
Chapter 9 Data Handling Data
A collection of numbers (values) gathered to give some information is called data.
Recording Data
Recording data is information in numbers collected for a specific purpose. The collection of data is also called recording of data. In order to record the data, we need to make a table and record it.
e.g. If you collects the marks obtained by 6 students in a batch to analyse their performance in unit test. We find that Raghav scored 11 out of 20, Maria scored 18 out of 20, Punit scored 15 out of 20, Zoya scored 8 out of 20, Salman scored 2 out of 20 and Manoj scored 12 out of 20.
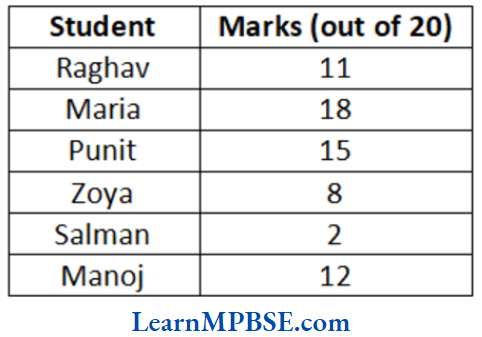
From this data, we conclude that highest marks obtained by Maria and lowest marks obtained by Salman.
Organisation of Data
The data that is collected for the first time is called raw data or upgrouped data. When the data is arranged in any data it becomes grouped data. When the data is very large, it is difficult to arrange them in a grouped form. In this case, small bars are used to represent data; such method is called tally method.
Read and Learn More MP Board Class 6 Maths Solutions
To get the required information, all observations should be recorded. We depict each observation with the help of tally marks.
Tally marks are used to organise the observations. Record every observation by a vertical mark, but every fifth observation should be recorded by a mark across the four earlier marks. The fifth observation tally mark looks like this ![]()
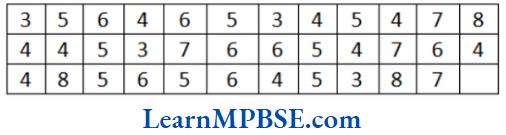
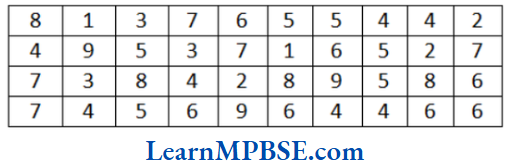
Example 1. In a class test, the following marks were obtained in the unit test of algebra by 35 students. Arrange these marks in a table using tally marks.
(1) Find how many students obtained marks equal to or less than 5.
(2) How many students obtained marks above 6?
Solution. The table with tally marks is shown below
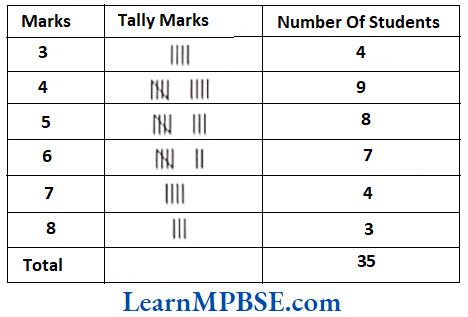
(1) Here, we have to find out the students, who obtained marks equal to or less than 5. So, we have to add the number of students who obtained marks equal to 5 or less than 5 i.e. marks 3, 4 and 5.
∴ Number of students = 4 + 9 + 8 = 21
Hence, 21 students obtained marks equal to or less than 5.
(2) Here, we have to find out the students who obtained marks above 6.
So, we have to add the number of students who obtained marks above 6 i.e. marks 7 and 8.
∴ Number of students = 4 + 3 = 7
Hence, 7 students obtained marks above 6.
Mp Board Class 6 Maths Solutions
Example 2. In a shop, different size of shoes sold in a week as shown below 7, 9, 10, 8, 7, 9, 7, 9, 6, 3, 5, 5, 7, 10, 7, 8, 7, 9, 6, 7, 6, 7, 10, 5, 4, 3, 5, 7, 8, 7, 9, 7.
Arrange the above data in ascending order and construct a table using tally marks.
Also, answer the following questions.
(1) Which shoes size had the maximum sale?
(2) Which shoes size had the minimum sale?
(3) Find the number of shoes sold of size 7 or greater than 7.
Solution. Ascending order of the given data is 3, 3, 4, 5, 5, 5, 5, 6, 6, 6, 7, 7, 7, 7, 7, 7, 7, 7, 7, 7, 7, 8, 8, 8, 9, 9, 9, 9, 9, 10, 10, 10
The table with tally marks is given below
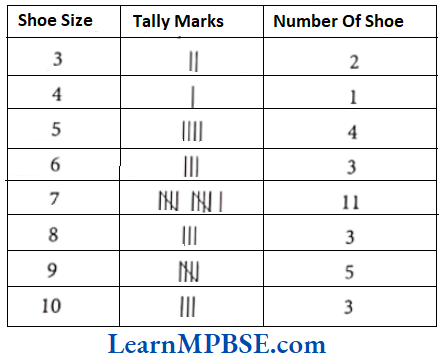
(1) Here, the shoes size had the maximum sale = 7
(2) Here, the shoes size had the minimum sale = 4 (iii) Here, we have to find out the number of shoes sold of size 7 or greater than 7.
So, we have to add number of shoes sold of size 7 or greater than 7 i.e., size 7, 8, 9 and 10.
∴ Required number of shoes = 11 + 3 + 5 + 3 = 22
Hence, 22 shoes sold of size of 7 or greater than 7.
Chapter 9 Data Handling Pictograph
Pictograph is the way of representing data using pictures of objects. Each picture (image) stands for a certain number of objects. It helps us to answer the questions on the data at a glance.
Interpretation of a Pictograph
Interpretation of a pictograph means finding some conclusions from it. In interpretation of a pictograph, the first step is to know what it represents or what information is given by it.
It is also important to know the number of units represented by one picture symbol.
Example 3. Following pictograph represents some surnames of people listed in the telephone directory of a city.
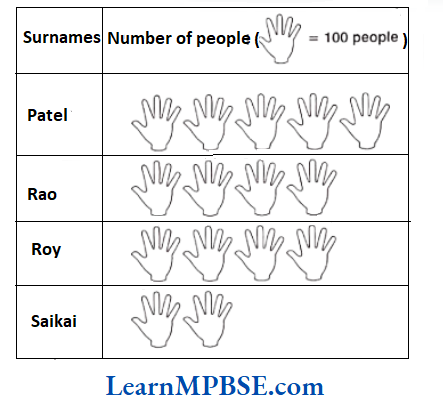
Observe the pictograph and answer the following questions:
(1) How many people have surname Roy?
(2) Which surname appears the maximum number of times in the telephone directory ?
(3) Which surname appears the least number of times in the telephone directory ?
(4) Which two surnames appear an equal number of times?
Solution. (1) The number of people having surname Roy are 400. Because in the given pictograph, the picture symbol represents 100 people.
(2) Surname Patel appears maximum number of times. Because in the given pictograph, the picture symbol represents 100 people. According to this, surname Patel appears 500 times.
(3) The surname Saikia appears the least number of times. Because in the given pictograph, the picture symbol represents 100 people. According to this, surname Saikia appears 200 times.
(4) The surname Rao and Roy appears an equal number of times.
Example 4. The colours of car preferred by people living in a society are shown by the following pictograph.
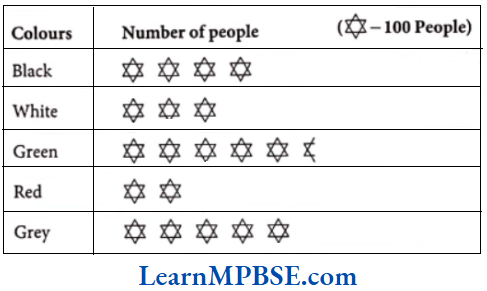
Look at this and answer the following questions.
(1) Find the number of people preferring white colour.
(2) How many people liked green colour?
(3) Find the sum of number of people who prefers black and red colour.
Solution. (1) White colour is preferred by 300 people.
(2) For 5 complete picture, we get 5 x 100 = 500 people and for 1 incomplete picture, we may roughly take it as 50 people.
Hence, the number of people prefers green colour is nearly 550.
(3) We have to find the sum of number of people who prefers black and red colour. So, we have to add the number of peoples who preferred black and red colour.
Now, the number of people who prefers black colour = 4 × 100 = 400
and the number of people who prefers red colour = 2 × 100 = 200
∴ Sum of number of people prefers black and red colour = 400 + 200 = 600
Hence, 600 people prefers the black and red colour.
Mp Board Class 6 Maths Solutions
Example 5. A survey was carried out in a certain school to find out different modes of transport used by students to travel to school each day, 30 students of Class VI were interviewed and the data obtained was displayed in the form of pictographs given below.
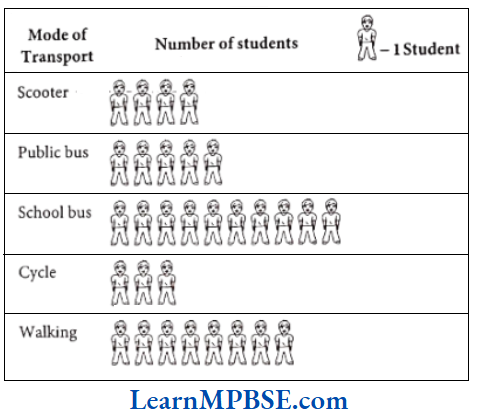
Look at this and answer the following questions.
(1) Which is the most popular mode of travel?
(2) Find the number of students who used walking as mode of travel.
(3) Which mode of travel is least used by the student?
Solution. (1) Maximum number of students use the school bus. Therefore, this is the most popular mode of travel.
(2) The number of students who use walking as mode of travel is 8.
(3) Cycle is used only by three students. Therefore, this mode of travel is least used by the students.
Chapter 9 Data Handling Exercise 9.1
Question 1. In a Mathematics test, the following marks were obtained by 40 students. Arrange these marks in a table using tally marks.
(1) How many students obtained marks equal to or more than 7?
(2) How many students obtained marks below 4?
Solution. The table with tally marks is shown below
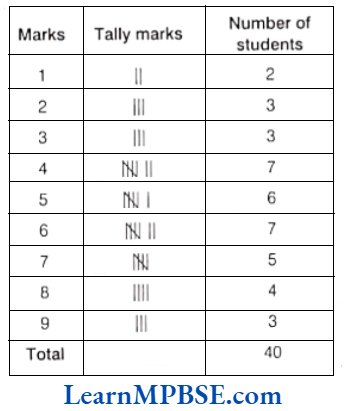
(1) Here, we have to find out the students, who obtained marks equal to 7 or more than 7.
So, we have to add the number of students who obtained marks equal to 7 or more than 7 i.e. marks 7, 8 and 9.
∴ Number of required students = 5 + 4 + 3 = 12
Hence, 12 students obtained marks equal to 7 or more than 7.
(2) Here, we have to find out the students who obtained marks below 4.
So, we have to add the number of students who obtained marks below 4 i.e., 1, 2 and 3.
∴ Number of required students = 3 + 3 + 2 = 8
Hence, 8 students obtained marks below 4.
Mp Board Class 6 Maths Solutions
Question 2. Following is the choice of sweets for 30 students of Class VI.
Ladoo, Barfi, Ladoo, Jalebi, Ladoo, Rasgulla, Jalebi, Ladoo, Barfi, Rasgulla, Ladoo, Jalebi, Jalebi, Rasgulla, Ladoo, Rasgulla, Jalebi, Ladoo, Rasgulla, Ladoo, Ladoo, Barfi, Rasgulla, Rasgulla, Jalebi, Rasgulla, Ladoo, Rasgulla, Jalebi and Ladoo.
(1) Arrange the names of sweets in a table using tally marks.
(2) Which sweet is preferred by most of the students?
Solution. (1) The table with tally marks is shown below
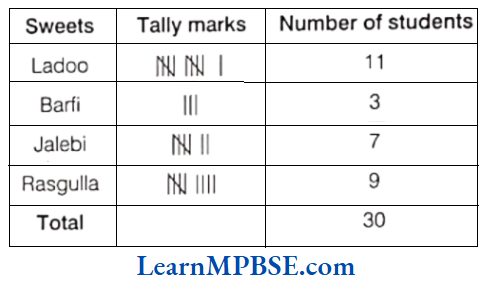
(2) By examine the above table, we see that Ladoo is preferred by most of the students. i.e. 11 students.
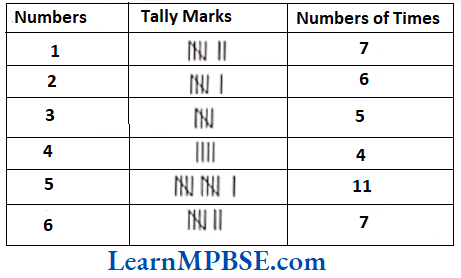
Question 3. Catherine threw a dice 40 times and noted the number appearing each time as shown below
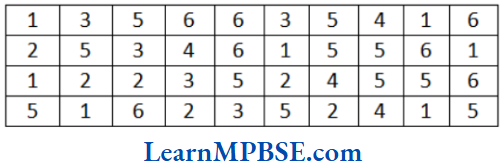
Make a table and enter the data using tally marks. Find the number that appeared
(1) the minimum number of times.
(2) the maximum number of times.
(3) Find those numbers that appear an equal number of times.
Solution. The table with tally marks is shown below.
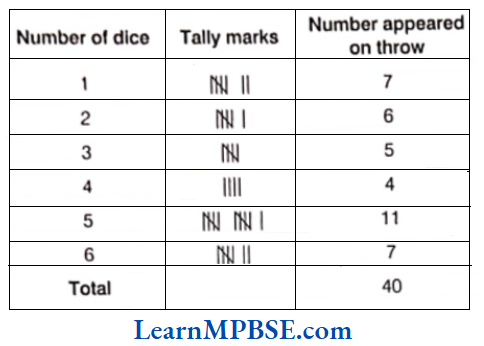
(1) From the above table, number 4 appeared 4 times while throwing a dice.
Thus, number 4 appeared the minimum number of times i.e. 4 times.
(2) While throwing a dice, number 5 appeared 11 times which is highest.
Thus, the maximum number of times the number 5 appeared.
(3) Number 1 and number 6 both appeared 6 times while throwing a dice.
Hence, number 1 and number 6 appeared an equal number of times.
Question 4. Following pictograph shows the number of tractors in five villages.
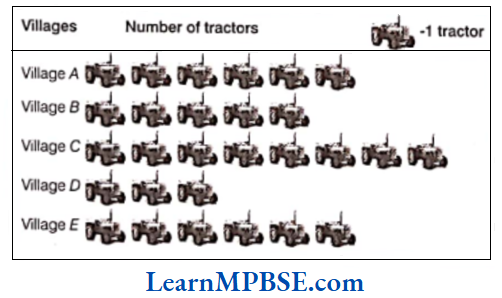
Observe the pictograph and answer the following questions.
(1) Which village has the minimum number of tractors?
(2) Which village has the maximum number of tractors?
(3) How many more tractors village C has as compared to village B?
(4) What is the total number of tractors in all the five villages?
Solution. (1) Observing the pictograph, it is clear that village D has the minimum number of tractors i.e. only 3 tractors.
(2) Observing the pictograph, it is clear that village Chas the maximum number of tractors i.e. 8 tractors.
(3) Observing the pictograph, it is clear that village C has 8 tractors and village B has 5 tractors.
So, village C has 8 – 5 = 3 more tractors as compared to village B.
(4) Total number of tractors in all the five villages
= Sum of all tractors in villages A, B, C, D and E
= 6 + 5 + 8 + 3 + 6 = 28
Hence, there are 28 tractors in all the five villages.
Mp Board Class 6 Maths Solutions
Question 5. The number of girl students in each class of a co-educational middle school is depicted by the pictograph.
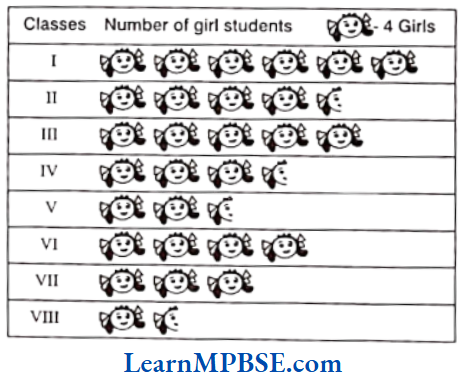
Observe this pictograph and answer the following questions.
(1) Which class has the minimum number of girl students?
(2) Is the number of girls in Class VI less than the number of girls in Class V?
(3) How many girls are there in Class VII?
Solution. In the given pictograph, 1 picture = 4 girls, half picture = 2 girls
(1) Observing the pictograph, it is clear that the minimum number of girl students are in Class VIII i.e. 4 + 2 = 6
(2) Observing the pictograph, it is clear that
Number of girls in Class VI = 4 x 4 = 16
and number of girls in Class V = 2 x 4 + 1 × 2 = 8 + 2 = 10
∴ 10 < 16
So, it is clear that number of girls in Class VI is not less than the number of girls in Class V.
(3) Observing the pictograph, number of girls in Class VII = 3 x 4 = 12
Mp Board Class 6 Maths Solutions
Question 6. The sale of electric bulbs on different days of a week is shown below
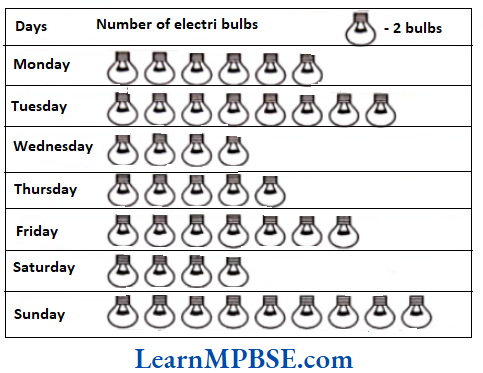
Observe the pictograph and answer the following questions.
(1) How many bulbs were sold on Friday?
(2) on which day, were the maximum number of bulbs sold?
(3) on which of the days, same number of bulbs were sold?
(4) On which of the days, minimum number of bulbs were sold?
(5) If one big carton can hold 9 bulbs. How many cartons were needed in the given week?
Solution. In the given pictograph, 1 picture = 2 bulbs
Now, number of bulbs sold on Monday = 6 pictures = 6 x 2 = 12 bulbs
Number of bulbs sold on Tuesday = 8 x 2 = 16 bulbs
Number of bulbs sold on Wednesday = 4 x 2 = 8 bulbs
Number of bulbs sold on Thursday = 5 x 2 = 10 bulbs
Number of bulbs sold on Friday = 7 x 2 = 14 bulbs
Number of bulbs sold on Saturday = 4 x 2 = 8 bulbs
Number of bulbs sold on Sunday = 9 x 2 = 18 bulbs
(1) Number of bulbs sold on Friday = 7 x 2 = 14 bulbs
(2) Maximum number of bulbs were sold on Sunday i.e. 18 bulbs.
(3) The same number of bulbs were sold on Wednesday and Saturday i.e. 8 bulbs.
(4) The minimum number of bulbs were sold on Wednesday and Saturday i.e. 8 bulbs.
(5) Total number of bulbs sold in a week
= 12 + 16 + 8 + 10 + 14 + 8 + 18 = 86
Now, number of cartons which can hold 9 bulbs = 1
∴ Number of cartons which can hold 1 bulb = \(\frac{1}{9}\)
= \(\frac{1 \times 86}{9}\)
= \(\frac{86}{9} = 9 \frac{5}{9} = 10\)
[as number of cartons should be an integer]
Hence, 10 cartons were needed in the given week.
Chapter 9 Data Handling Multiple Choice Questions
Question 1. The marks (out of 10) obtained by 28 students in a Mathematics test are listed as given below.
8, 1, 2, 6, 5, 5, 5, 0, 1, 9, 7, 8, 0, 5, 8, 3, 0, 8, 10, 10, 3, 4, 8, 7, 8, 9, 2, 0
The number of students who obtained marks more than or equal to 5 is
- 13
- 15
- 16
- 17
Answer. 4. 17
Question 2. In question 1 (above), the number of students who scored marks less than 4 is
- 15
- 13
- 12
- 10
Answer. 4 10
Class 6 Maths Chapter 9 Solutions Mp Board
Question 3. The choices of the fruits of 42 students in a class are as follows.
A, O, B, M, A, G, B, G, A, G, B, M, A, G, M, A, B, G, M, B, A, O, M, O, G, B, O, M, G, A, A, B, M, O, M, G, B, A, M, O, M, Observe
Where A, B, G, M and O stand for the fruits Apple, Banana, Grapes, Mango and Orange, respectively. Which two fruits are liked by an equal number of students?
- A and M
- M and B
- B and O
- B and G
Answer. 4. B and G
Question 4. According to data of question 4, which fruit is liked by most of the students?
- O
- G
- M
- A
- Answer. 3. M
Question 5. Following table shows the number of bikes manufactured in a factory during the year 1998 to 2002.
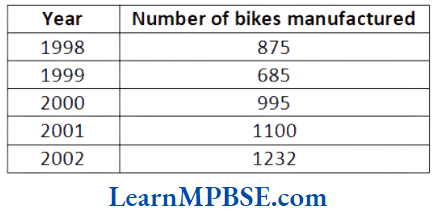
In which year were the maximum number of bikes manufactured?
- 2002
- 2001
- 2000
- 1999
Answer. 1. 2002
Question 6. Using the data of question (8). Find the difference between number of bikes manufactured in the years 1999 and 2000.
- 300
- 305
- 310
- 410
Answer. 3. 310
Question 7. A pictograph represents data in the form of
- vertical bar
- horizontal bar
- pictures
- None of these
Answer. 3. pictures
Class 6 Maths Chapter 9 Solutions Mp Board
Chapter 9 Data Handling Assertion-Reason
Question 1. Assertion (A) The students get a marks in Maths test out of 20 are 10, 15, 19, 17, 05, 8, 12.
So, the maximum marks in the test obtained by the students is 19.
Reason (R) The tally marks represents 10.
(a) Both A and R are True And R is the correct explanation of A.
(b) Both A and R are true but R is not the correct explanation of A.
(c) A is true but R is false.
(d) A is false but R is true.
Answer. (b) Both A and R are true but R is not the correct explanation of A.
Question 2. Assertion (A) The sale of balls on different days of a week is shown below.
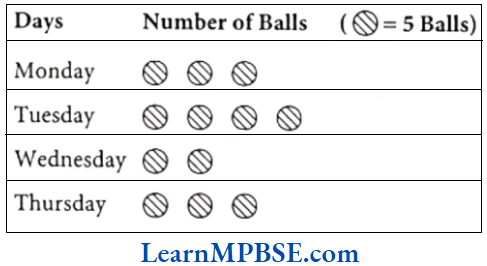
The balls sold on Thursday are 15.
Reason (R) A pictograph represents data through symbols or pictures.
(a) Both A and R are True And R is the correct explanation of A.
(b) Both A and R are true but R is not the correct explanation of A.
(c) A is true but R is false.
(d) A is false but R is true.
Answer. (a) Both A and R are true and R is the correct explanation of A.
Chapter 9 Data Handling Fill in the Blanks
Question 1. A ….. is a collection of numbers gathered to give some meaningful information.
Answer. data
Question 2. The data can be arranged in a tabular form using …. marks.
Answer. tally
Question 3. The tally marks represents |||| represents …… .
Answer. 4
Question 4. Representation of data in form of pictures is called ….. .
Answer. pictograph
Question 5. In a pictograph, if a symbol * represents 20 flowers in a basket, then *** stands for ….. flowers.
Answer. 60
Class 6 Maths Chapter 9 Solutions Mp Board
Chapter 9 Data Handling True/False
Question 1. An observation occurring five times in a data is recorded as |||||, using tally marks.
Answer. False
Question 2. Tally marks |||| represents 4.
Answer. True
Question 3. Pictograph is pictorial representations of the numerical data.
Answer. True
Question 4. In a pictograph, if a symbol represents 50 books in a library shelf, then the symbol represents 25 books.
Answer. True
Question 5. In a pictograph, if a symbol represents 100 books in a library shelf, then the symbol represents 50 books.
Answer. False
Chapter 9 Data Handling Match The Columns
Question 1. Match the items of Column 1 with their respective value in Column 2.
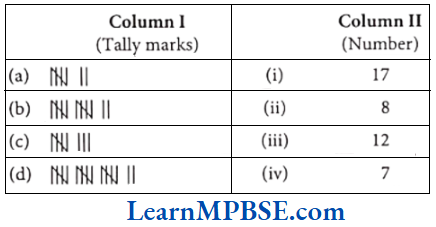
Answer. (a) → (4), (b) → (3), (c) → (2), (d) → (1).
Chapter 9 Data Handling Case Based Questions
Question 1. Shobit works for a shoe store. He records the shoe sizes and the number of pairs sold every day. On Tuesday, he sold 60 pairs. His record for the day is shown below.
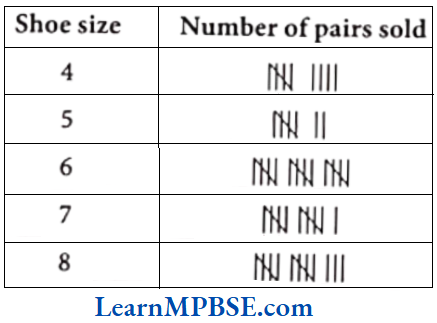
(1) How many pairs of size 8 were sold on Tuesday?
(a) 3
(b) 10
(c) 11
(d) 13
(2) Which shoe size sold the most?
(a) 6
(b) 7
(c) 8
(d) 9
Class 6 Maths Chapter 9 Solutions Mp Board
(3) Shobit realised that he had not fully recorded the sale for Tuesday. How many sold pairs had he not recorded?
(4) The unrecorded data was of shoe size 7. Shobit corrected his record accordingly. Which of the following statements will be true now?
(a) Shoe size 8 sold the least now
(b) Shoe size 7 sold the most now
(c) Shoe size 5 is the new mode of the data
(d) Number of shoe pairs of size 3 can be calculated
(5) The price of one shoe pair of size 5 is ₹ 800. How much money had Shobit collected by selling all the shoe pairs of size 5?
Solution. (1) (d) On Tuesday, Shobit sold 13 pairs of shoes.
(2) (a) Shoe size 6 sold the most.
(3) Shobit recorded the sale of 55 pairs for Tuesday, but he sold 60 pairs. Thus, he had not recorded 5 pairs of shoes.
(4) (b) The correct statements after Shobit corrected his record is that shoe size 7 sold the most now i.e., 16 pairs.
(5) Shobit sold 7 pairs of shoes of size 5 on Tuesday. And the price of one shoe pair of size 5 is 800.
Thus, the money collected by selling all the shoe pairs of size 5 = 7 x 800 = ₹ 5600
Question 2. The marks obtained by 10 students in Science test are given below.
53, 36, 95, 3, 62, 42, 25, 78, 75, 62
Answer the following questions that are related to the given data.
(1) The maximum marks obtained by any student is
(a) 60
(b) 95
(c) 78
(d) 25
(2) The minimum marks obtained by any student is
(a) 42
(b) 36
(c) 25
(d) 73
(3) How many students got the same marks?
(a) 3
(b) 4
(c) 2
(d) None of above
(4) How many students got 78 or more marks?
(a) 2
(b) 3
(c) 1
(d) 4
(5) How many students got marks below 62?
(a) 3
(b) 4
(c) 5
(d) 2
Solution. (1) → (b), (2) → (c), (3) → (c), (4) → (a), (5) → (b)
Mp Board Maths Chapter 9 Solutions
Chapter 9 Data Handling Very Short Answer Type Questions
Question 1. The following are the weight in kg of 20 students of a class 25, 15, 17, 15, 23, 10, 9, 15, 16, 17, 15, 16, 23, 25, 16, 15, 23, 9, 10, 16
Prepare a table using tally marks for the given data.
Also, answer the following questions.
(1) Find the number of students whose weights are equal to 17 or more than 17.
(2) How many students whose weights are below 16.
Solution.
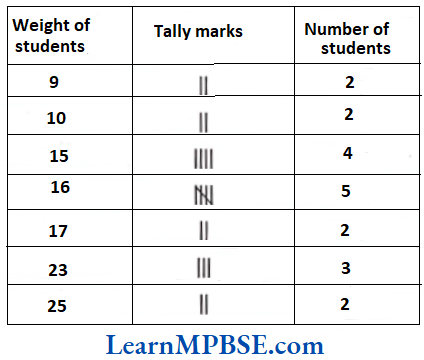
(1) 7
(2) 8
Question 2. Following is the choice of sports for 20 students of Class 6. Cricket, Football, Cricket, Tennis, Cricket, Badminton, Football, Cricket, Football, Tennis, Cricket, Badminton, Basketball, Football, Golf, Football, Hockey, Football, Hockey, Football
(1) Arrange the names of sports in a table using tally marks.
(2) Which sports is preferred by most of the students?
Solution.
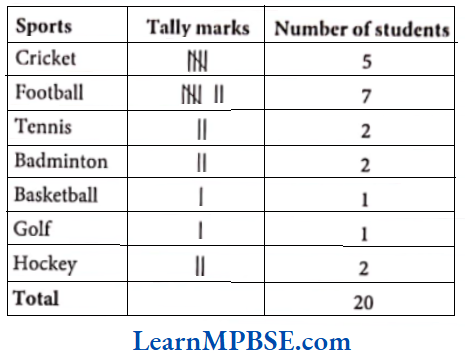
(2) 7 students preferred football which is highest. Thus, football is preferred by most of the students.
Question 3. Maria threw a dice 30 times and noted the number appearing each time as shown below.
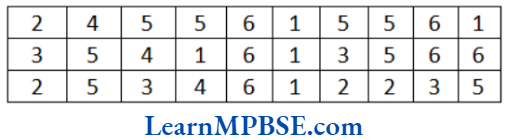
Prepare a table using tally marks and answer the following questions.
(1) Find the number that appeared the minimum number of times.
(2) Find the number that appeared the maximum number of times.
(3) How many times the number 2 and 3 appeared?
Solution.
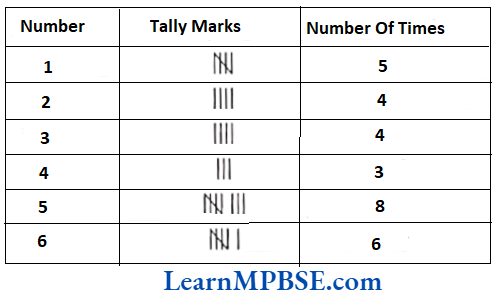
(1) 4
(2) 5
(3) 4 times
Mp Board Class 6 Book Solutions
Question 4. The pictograph shows the number of persons using various brands of perfumes.
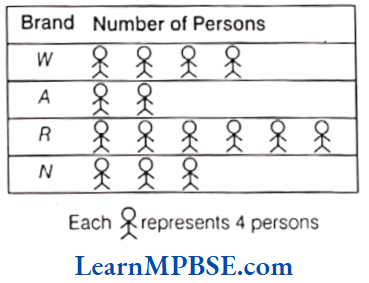
(1) How many persons use R brand?
(2) Which brand is used by maximum number of persons?
Solution. (1) 24 persons (2) R brand
Chapter 9 Data Handling Short Answer Type Questions
Question 1. The following pictograph shows the number of private buses in six cities.
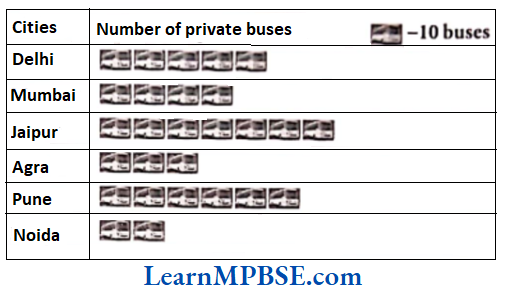
(1) In which city the number of private buses are least?
(2) In which city the number of private buses are highest?
(3) How many more buses in Delhi as compared to Agra?
(4) Find the total number of buses in all the six cities.
Solution. (1) Noida
(2) Jaipur
(3) 20
(4) 270
Question 2. In a electrical shop, the sale of fans on different days of a week is shown by below pictograph.
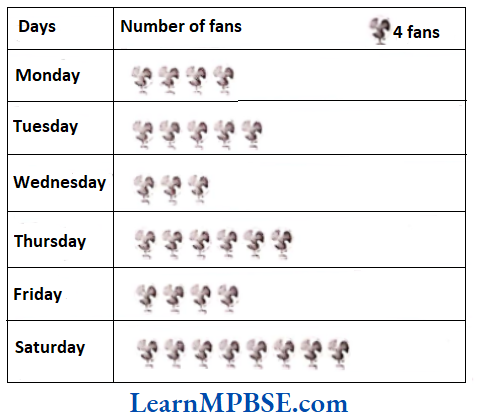
By observing the given pictograph answer the following questions.
(1) Find the number of fans sold on Tuesday.
(2) On which of the days, the number of fans were sold is same?
(3) On which day, the number of fans were sold is maximum?
(4) On which day, the number of fans were sold is minimum?
(5) Find the total number of fans were sold in all the days of this week.
Solution. (1) 20
(2) Monday and Friday
(3) Saturday
(4) Wednesday
Mp Board Class 6 Book Solutions
Question 3. Following is the pictograph of the number of cycles manufacture by a factory on six different working days of a week.
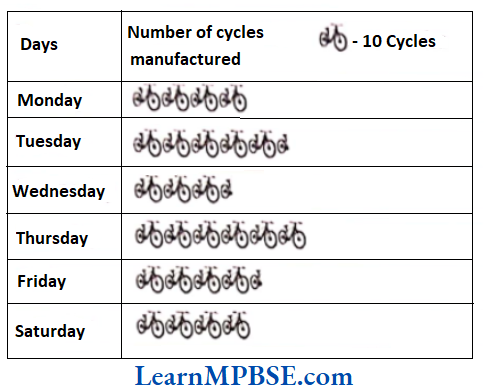
By observing the given pictograph and answer the following questions.
(1) On which day were the least number of cycles manufactured?
(2) On which day were the maximum number of cycles manufactured?
(3) Find the approximate number of cycles manufactured in all the six working days of the given week.
(4) On which of the days, the number of cycles manufactured is same?
Solution. (1) Wednesday
(2) Thursday
(3) 275
(4) Monday and Saturday
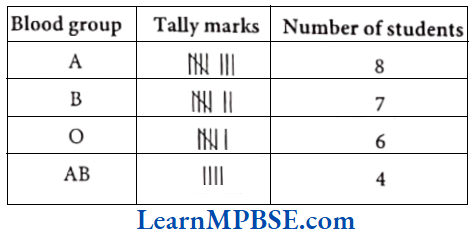
Question 4. The blood groups of 25 students are recorded as follows
A, B, O, A, AB, O, A, O, B, A, O, B, A, AB, AB, A, A, B, B, O, B, AB, O, A, B. Arrange the information in a table using tally marks.
Solution. The information in a table using tally marks is as follows:
Question 5. Rakesh is playing with a dice. He threw the dice 40 times and noted the outcomes as follows.
1, 2, 1, 5, 3, 5, 5, 3, 2, 2, 1, 6, 6, 6, 4, 6, 3, 5, 2, 3, 3, 5, 4, 1, 5, 5, 2, 4, 5, 5, 2, 4, 5, 5, 2, 4, 1, 6, 6, 1, 5, 6, 1, 5.
Prepare a table using tally marks.
Solution. We draw the following table using tally marks from given information.
Class 6 Mp Board Maths Question Answers
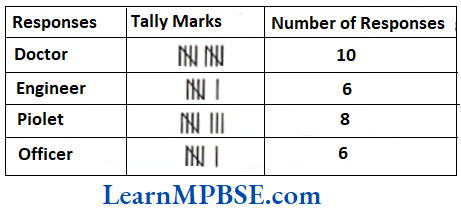
Question 6. Thirty students were interviewed to find out what they want to be in future. Their responses are listed as below
doctor, engineer, doctor, pilot, officer, doctor, engineer, doctor, pilot, officer, pilot, engineer, officer, pilot, doctor, engineer, pilot, officer, doctor, officer, doctor, pilot, engineer, doctor, pilot, officer, doctor, pilot, doctor, engineer.
Arrange the data in a table using tally marks.
Solution. We draw the following table using tally marks for given information.
Chapter 9 Data Handling Long Answer Type Questions
Question 1. The following pictograph depicts the information about the areas in sq km (to nearest hundred) of some districts of Chattisgarh State.
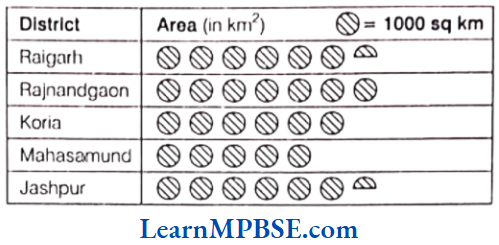
(1) What is the area of Koria district?
(2) Which two districts have the same area?
(3) How many districts have area more than 5000 km?
Solution. (1) Area of Koria district = 6000 sq km
(2) Raigarh and Jashpur have the same area.
(3) Four districts have area more than 5000 sq km.
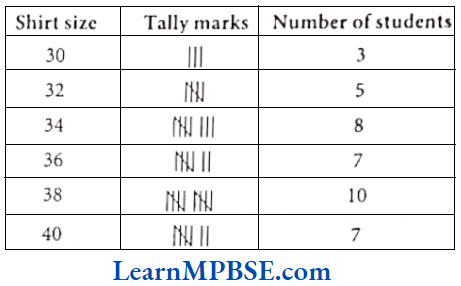
Question 2. Fill in the blanks in the following table, which represents shirt size of 40 students of a school.
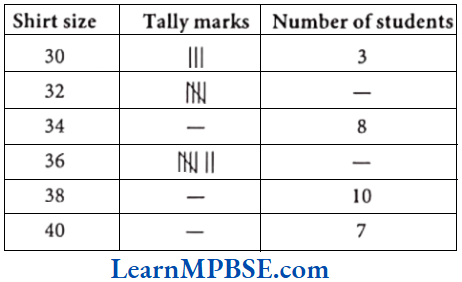
Solution. (1) ![]() shows four vertical lines and one intersecting line.
shows four vertical lines and one intersecting line.
∴ It counts to be four plus one (i.e. 5).
(2) We know that
8 = 5 + 3
Here, 5 is represented by ![]() and 3 is represented by |||.
and 3 is represented by |||.
∴ 8 is represented by ![]() |||.
|||.
(3) ![]() || means 5 + 2 i.e. 7.
|| means 5 + 2 i.e. 7.
(4) We know that
10 = 5 + 5
Here, 5 is represented by ![]() .
.
∴ 10 is represented by ![]()
![]()
(5) We know that 7 = 5 + 2
Here, 5 is represented by ![]() and 2 is represented by ||.
and 2 is represented by ||.
∴ 7 is represented by ![]() ||.
||.
Thus, the complete table is shown below
MP Board Class 6 Chapter 9 Maths
Question 3. The number of scouts in a school is depicted by the following pictograph.
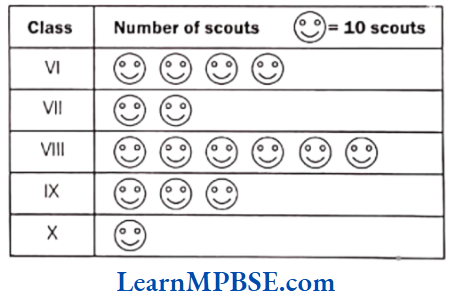
Observe the pictograph and answer the following questions.
(1) Which class has the minimum number of scouts?
(2) Which class has the maximum number of scouts?
(3) How many scouts are there in class 6?
(4) Which class has exactly four times the scouts as that of Class 10?
(5) What is the total number of scouts in the classes 6 to 10?
Solution. (1) Class 10 has minimum number of scouts i.e. 10.
(2) Class 8 has maximum number of scouts i.e. 60.
(3) Number of scouts in Class 6 = 40
(4) Number of scouts in Class 10 = 10
Hence, Class 6 has exactly four times the scouts as that of Class 10.
(5) Total number of scouts in classes 6 to 10
= 40 + 20 + 60 + 30 + 10 = 160