NEET Biology Plant Water Relations
- Permeability. A large number of substances enter the cell and a large amount goes out of the cell during various biological activities. This is due to the permeability exhibited by cells.
- Solute. A substance that is dissolved in a liquid is called a solute,
- Solvent. The liquid in which substances are dissolved is called solvent,
- Solution. A liquid with substances dissolved in it is called a solution,
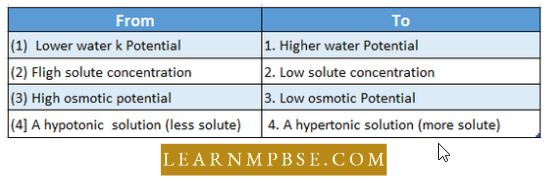
- Hypotonic solution. Less concentrated solution than cell sap.
- Hypertonic solution. More concentrated solution than cell sap.
- Isotonic solution. Two solutions with the same concentration of solute and have the same osmotic pressure.
- Molal Solution is a solution having 1 gm mole of a solute dissolved in 1 liter of solvent. Molal solution is also called weight solution,
- The molar solution is that solution when 1 gm mole of a solute is dissolved in water to make the volume 1 liter.
- Permeable membrane. These membranes allow diffusion of both solvent and solute molecules or ions across them, For Example, cellulose cell wall.
- Differentially permeable membrane. It is a membrane that allows some substances to pass through, but not others, For Example, Plasma membrane,
- Impermeable membranes. Such membranes prohibit the diffusion of both solvent and solute particles through them e.g. heavily cutinized or suberized cell walls,
- Semipermeable membranes. Such membranes allow diffusion of solvent molecules but do not allow the passage of solute molecules e.g. plasma membrane.
Read and Learn More NEET Biology Notes
Plant Water Relations NEET Notes
NEET Biology Plant Water Relations Chemical Potential
- It is the free energy of one mole of a substance in a system under constant temperature and pressure) All reactions under pressure involve a decreased chemical potential of free energy. The chemical potential of pure water is taken as zero. It is represented by the symbol Ω/ (psi) and is measured in_bars and atmosphere.
- Water potential is determined by three major” sets of internal factors. Matric potential (ψm), solute potential (ψs), and pressure potential (ψp). Water potential is written as
- ψ=ψm + ψs + ψp
- Osmotic pressure O.P. = C.R.T.
- O.P. = C.R.T, where C = Concentration, R – Gas const. T = Temp. It is a +ve pressure.
- Osmotic pressure can be defined as “the actual pressure which develops in a solution when it is separated from pure water using a semipermeable membrane.
- The pressure needed to prevent the passage of water into the solution through a semipermeable membrane, thus preventing an increase in the volume of the solution.
- It is the maximum pressure that can develop in an osmotically active solution when it is separated from its pure solvent by a semipermeable membrane under ideal conditions. An osmometer is an apparatus that is used to measure the osmotic pressure of a solution.
The osmotic pressure of a solution depends upon :
- The concentration of solute particles. An increase in the concentration of solute in the solution increases the osmotic pressure of a solution.
- Ionisation of solute particles. If the solute ionizes in solution, the number of particles increases, so raising the osmotic pressure. The osmotic pressure of a solution of an ionizing substance would be greater than the equimolar concentration of a non-ionizing substance.
- Temperature. An increase in temperature raises the osmotic pressure of a solution.
- The osmotic pressure of a given solution (non-electrolyte) such as sucrose can be calculated by using the following relationship.
- O.P. = CRT
- C is the molar concentration of the solution
- R is the gas constant which is 0.082 and
- T is the absolute temperature i.e. 273 + t°C.]
Plant Water Relations NEET Notes
A molar solution of sucrose solution separated from pure water by a semipermeable membrane has an O.P. of approximately 22.4 ms. at 0°C.
NEET Biology Plant Water Relations Turgor Pressure (Tp) And Wall Pressure (Wp)
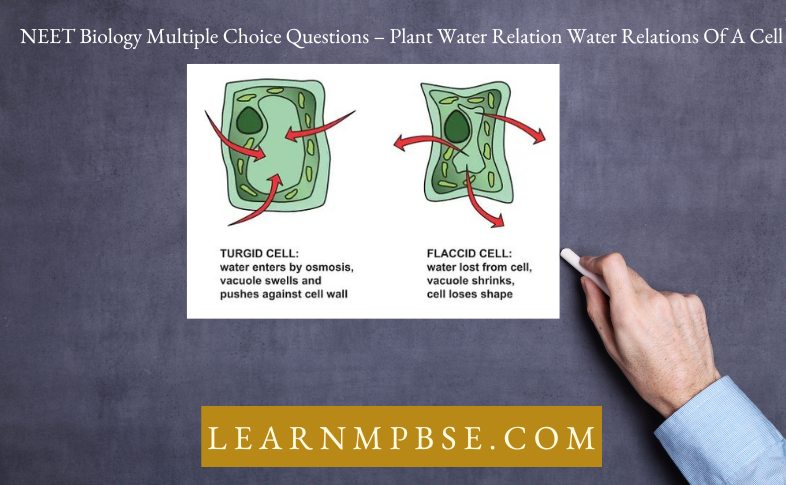
- The outward pressure exerted on the cell wall by the cell contents is called turgor pressure.
- Wall pressure. The inward pressure exerted on the cell contents by the stretched cell wall is called wall pressure.
- The two pressures are equal and opposite in direction.
- At equilibrium TP = WP.
- T.P∝ to the amount of water absorbed.
- When TP > WP → cell will burst.
- TP < WP→ cell will not get turgid.
- Thus, T.P. causes the dilution of cell sap.
- T.P. maintains the turgidity and rigidity of”the ceils.
- The upright position of a shoot in a very young seedling depends on T.P.
- W.P. acts against the osmotic entry of water into the cell.
NEET Biology Plant Water Relations Diffusion Pressure Deficit (Dpd)
The disparity between osmotic pressure (OP) and turgor pressure (TP) is referred to as suction pressure (SP) or diffusion pressure deficit (DPD). It is sometimes referred to as Suction Pressure.
NEET Biology Plant Water Relations Plasmolysis
It is the shrinkage of the contents of a cell when it is placed. in a hypertonic solution.
It is of three types :
- Limiting Plasmolysis. Cell size is minimum but cytoplasm does not withdraw from the cell wall.
- Incipient Plasmolysis. Cytoplasm withdraws itself from the cell wall.
- Evident Plasmolysis. Cytoplasm withdraws itself from the cell wall except at a few points.
- Limiting plasmolysis is used for studying osmotic potential.
- Deplasmolysis.It is the absorption of water by the plasmolyzed cell so that it becomes turgid.
Plant Water Relations NEET Notes
NEET Biology Plant Water Relations Adsorption
The concentration of molecules or ions of a substance at a surface or boundary between two substances.
NEET Biology Plant Water Relations Osmosis
- It is the movement of solvent molecules from their place of high cone, to their place of the low cone when both are separated by selectively permeable membrane. Through this process roots absorb. water. It is of two kinds i.e. exosmosis and endosmosis.
- Importance of osmosis for plants. Several physiological processes are intimately associated with osmosis. Osmosis plays an important role in
- Entry of water into plant cells from the soil through root hairs.
- The distribution of water across the cell,
- The turgidity of plant cells is required for the maintenance of the forms of the plant
- The turgor pressure of guard cells is essential for the opening of stomata,
- The growth of young cells is brought about by OP and turgor pressure of the cells. Many plant movements depend upon the turgidity of cells. (W)fAutochoryjin fleshy fruits.
- Diffusion. It is the movement of gases, liquids, and solutes from a place of their higher cone to the lower cone. This process is helpful in photosynthesis and respiration.
- Imbibition. It is the physical process of absorption of water by the hydrophilic colloids of dry substances. The seeds swell up due to it.
- Imbibants or swelling substances exert considerable pressure which is called imbibition pressure (IP).
- imbibants hold water by capillarity and adsorption.
- D.P.D. = IP – TP
- The magnitude of this pressure (IP) is very significant e.g. Dried wooden piece when inserted into a rock, due to the swelling of the wood, enough pressure is created and cracks appear in the rock.
- In the same way, seeds in the bottle will break the bottle due to the swelling of the seeds.
- Imbibition is the first step in the absorption of water by the roots of higher plants and in the germination of seeds.
- Proteins have very high imbibing capacity, starch less, and cellulose least. This is why the proteinaceous seeds example: Pea, swell more on imbibition than those of starchy wheat seeds.
NEET Biology Plant Water Relations Absorption Of Water
- Roots absorb water from the soil. Root hairs play a key role in this purpose. Water absorption may be active or passive.
- Active absorption of water occurs due to the utilization of energy. It may be osmotic or non-osmotic.
- Passive absorption takes place due to surface force or Transpiration pull produced in leaves.
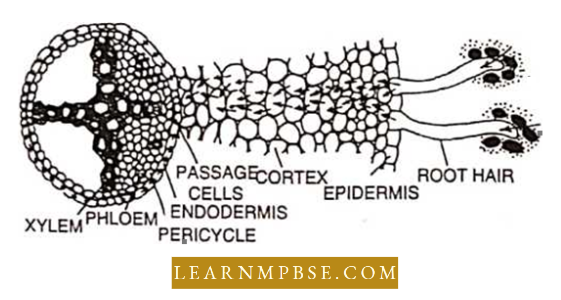
- A plant root is distinguishable into five regions. Maximum absorption of water occurs through the region of root hair. Internally, a root is distinguishable into the epidermis, cortex, and endodermis enclosing the stele. Unthickened passage cells are present in endodermis opposite to protoxylem groups.
- The soil complex comprises inorganic matter, organic matter, soil solution, soil air, soil moisture, and soil organisms. The source of soil water is atmospheric precipitation.
- The soil contains water in four different forms, namely capillary water, hygroscopic water, combined water, and water vapors. Of these, only capillary water is available to plants.
- The maximum water retaining capacity of soil is indicated by the term field capacity. A plant wilts permanently at the arrival of a permanent wilting percentage. The sum of the osmotic potential of the soil solution and soil moisture tension is called total soil moisture stress (TSMS).
- A plant may absorb water from the soil actively under no tension conditions or passively under the influence of a high rate of transpiration.
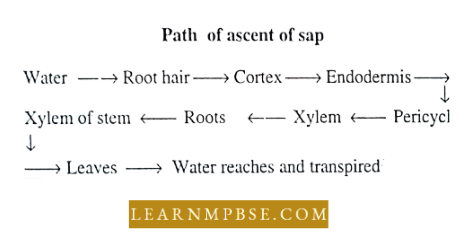
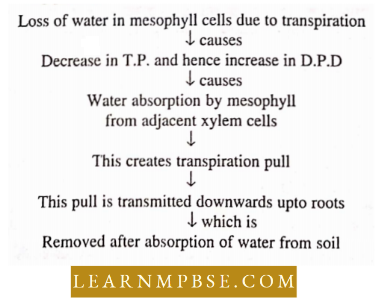
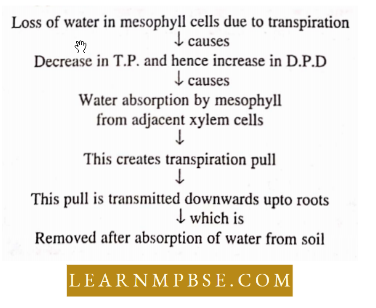
- An increased rate of transpiration increases the DPD of mesophyll cells. As a result, water is drawn from neighboring cells. The deficiency of water is then conveyed from the leaf xylem to the stem xylem and then to the root xylem. The root xylem takes water from the pericycle and tire deficiency is conveyed finally to the root hair.
- The root hair absorbs water due to increased suction tension endosmotically from the soil.
- The active osmotic absorption of water occurs by simple endosmosis through the root hair. It passes across the cortex along a gradient of DPD. A high concentration in the xylem is maintained by the addition of salts or sugars.
NEET Biology Plant Water Relations Absorption Of Water By Aerial Parts
The aerial portions of plants, especially the leaves, can absorb water from the atmosphere to a limited degree, contingent upon the water potential. The cutin and pectin layers of apple leaves exhibit significant water-absorbing ability.
- Breazeale et al. (1951) state that if water potential gradients are advantageous, water absorbed by the leaves of tomato and maize might go negatively, i.e., downward to the soil.
- Uptake of mineral salts. It occurs through both passive and aggressive mechanisms. In the initial scenario, energy is not implicated.
- They are assimilated through diffusion or ionic exchange methods. In the second scenario, the active absorption of minerals occurs via specific carriers, and ATP utilization is also involved.
Water Relations In Plant Cells NEET Study Material
NEET Biology Plant Water Relations Ascent Of Sap
The absorbed water ascends to the apex of the plant via the xylem. This phenomenon is referred to as the Ascent of sap. The xylem is the conduit for the upward movement of sap.
- This can be demonstrated using ringing tests (Malpighi, Stephen, and Hertig). Sap consists of water and mineral salts.
- It is relocated inside the xylem tissue, as evidenced by many investigations. Among the several theories proposed.
- Dixon’s idea regarding the cohesiveness of water and the transpiration pull theory is valid. It indicates that the ongoing loss of water from the aerial portions generates tension or a transpiration pull at the apex of the plant.
- It draws water from the base to the apex. Despite being influenced by transpiration pull, water molecules remain together because to the substantial cohesive forces of water.
- The water column remains intact, allowing the ascent of water (sap).
NEET Biology Plant Water Relations Theories To Explain Mechanism Of Ascent of Sag
Any acceptable theory to explain the mechanism of the ascent of sap must take into account the following features :
- Large quantities of water are conducted at very high speeds (average rate 1 meter/ hour).
- Xylem vessels are dead tubes with narrow lumens.
To move water through such tubes to the height of a tall tree requires great pressure (approximately 13 atm. pressure is required to raise water to the top of a 416 ft tall tree).
- Three types of theories have been proposed to explain the mechanism of the ascent of sap; vital theories, physical theories, and root pressure theory. According to vital theories, living cells are responsible for the ascent of sap.
- The physical theories believe that it is a physical phenomenon. The root pressure theory is partly physical and partly vital.
- According to the relay pump hypothesis of Godlewski, the water rises in the stem due to the activity of the cells of medullary rays and xylem parenchyma.
- The pulsation hypothesis of Bose suggests that water rises in the stem due to activity taking place in the innermost layer of the cortex.
- The root pressure is the pressure experienced by the tracheary elements due to the metabolic activity of root cells. Its presence is confirmed by bleeding and guttation. Root pressure is the positive hydrostatic pressure developed in roots due to the accumulation of absorbed water.
The term ‘root pressure’ was coined by Stephen Hales (1727). Stocking (1956) considered root pressure as an active process and defined it as “pressure developing in the tracheary elements of the xylem as a result of the metabolic activities of roots.”
- Root pressure is responsible for guttation and bleeding in plants. It is measured by a manometer. Maximum root pressure recorded in plants is 2 to 3 bars (0.2 to 0.3 MPa).
- This is sufficient to raise the column of water to a height of 21 meters.
- The role of root pressure in the ascent of sap in all plants is uncertain. At the most, it may be useful for the ascent of sap in herbs.
The main drawbacks of root pressure theory are :
- Root pressure is absent in gymnosperms which are some of the tallest trees.
- Root pressure is absent in actively transpiring plants.
- The ascent of sap was observed in plants even if the root system was removed.
- According to Boehm water rises in the stem due to the joint force of capillary and atmospheric pressure. Sachs, on the other hand, believed that the ascent of sap is due to the force of imbibition.
- The cohesion theory of Dixon and Jolly suggests that water rises in stem due to the cohesion of water molecules, continuity of the water column, and transpiration pull.
The main features on which this theory is based are :
- Right from the root hairs to the tips of the leaves, water forms a continuous network in the plants.
- Water molecules have high cohesion between them i.e., these tend to stick to each other, because, being polar, these are electrically attracted to each other, being held by hydrogen bonds. The high cohesive force means that a relatively large tension is required to break a column of water. In other words, the water column has a great tensile strength.
- The Lignocellulosic cell walls of xylem vessels have a strong affinity (adhesion) for water molecules. Therefore, a strong adhesive force exists between the walls of the xylem vessels and water i.e., water tends to ‘stick’ to the vessel wall.
- As the water is lost from the leaf surface by transpiration, the osmotic pressure of the ‘ leaf cells increases. As a result, the cells develop low water potential and water from the leaf veins (xylem) moves into leaf cells.
- The xylem vessels, in turn, draw water from the xylem of the main stem. A negative (pulling) pressure is thus exerted by all the leaves on the stem. The combined pressure, called transpiration pull, is strong enough to pull up the column of water to great heights.
- The tension of -80 bars can raise the column of water in the tallest tree. However, gravitational force prevents the transport of water. This hypothesis also suggests the conducting efficiency of tracheids over vessels which cannot be accepted.
NEET Biology Plant Water Relations Transpiration
The evaporation of water from the aerial parts of plants is called transpiration. It may be stomatal, epidermal, cuticular or lenticular.
About 98 percent of the water absorbed by land plants evaporates from the aerial parts of the plant and is lost into the atmosphere. 0.2% is used in photosynthesis.
Sites of transpiration. Transpiration may occur from the following three sites :
- Stomata. Approximately 90% of the transpiration occurs due to evaporation of water from leaf cells through stomata.
- Cuticle. Up to 10% of transpiration may take place from the outer walls of epidermal cells through the waxy cuticle. In herbaceous plants, it may reach up to 50%.
- Lenticels. A small fraction of transpiration occurs through lenticels (0.1%.)
Water Relations In Plant Cells NEET Study Material
Stomata. A stoma consists of two kidney-shaped or dumbbell-shaped guard cells. They cover hardly 1-2% of the leaf surface and may be surrounded by subsidiary cells. The number of stomata on the lower epidermis range between 10,000-58,000.
- The inner tangential walls of the guard cells are thick and they also show the radial arrangement of micelle (radial micellation).
- A leaf may be amphistomatic, hypostomatic, or epistomatic. Based on distribution, we differentiate apple type, potato type, oat type, water lily type, and Potamogeton type stomata.
- Based on daily movement (rhythmicity) three types of stomata are differentiated, namely, alfalfa type (Leucerene), which opens the whole day and close during the night, e.g. Pea, radish, mustard, turnip, beet, apple, grapes, bean, potato type, open all day and night except a few hours in the evening e.g. Onion, Cucurbita, Tulip, Bananas, barley (cereal) type, open only for a few a hours in a day e.g. maize, wheat, and Equisetum type, open all the time.
Photoactive and Scotoactive Stomata. Stomata that open during the day and close at night are called photoactive stomata. Generally, the stomata are photoactive. But, the stomata that close during the day and open at night are called scotoactive stomata. These are found in succulents like Bryophyllum, Opuntia, and Cacti.
NEET Biology Plant Water Relations Theories Of Opening And Closing Of Stomata
- The thickening of the inner tangential wall of the guard cells or the radial oscillation of the cell wall is thought to cause the opening and closing of stomata when they are turgid and flaccid.
- According to Von Mohl, the guard cells prepare some osmotically active substance which causes the opening of stomata. Linsbauer, on the other hand, thinks that it is the change in the permeability of guard cells that causes the opening and closing of stomata.
- According to Llyod, the conversion of starch into sugar in the daytime and vice versa at night causes the opening and closing of stomata. Sayre and Scarth are of the view that this conversion is controlled only by the pH of the guard cells whereas Steward regards that this is partly enzymatic and partly controlled by pH.
- Inamura reported that cytokinin and CAMP also require accumulation of K+ in the guard cells whereas Willmer et al. found the conversion of starch into organic acids and vice versa responsible for the opening and closing of stomata, while the opening of stomata is controlled by the accumulation of K+, Cl- and organic acid (malic acid), the closing is initiated by ABA.
The theory of K+ transport and hormonal regulation may be represented as :
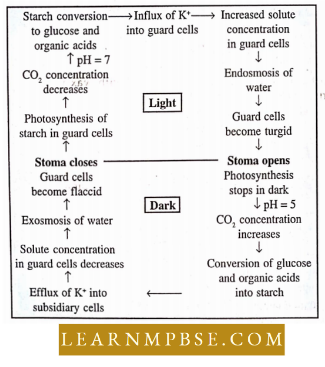
Levitt proposed a synthetic, proton transport hypothesis that states that the opening and closing of stomata is controlled by active K+ transport and pH of the guard cells.
Factors Affecting Stomatal Movement
The stomata] movement is affected by light. CO2 concentration. pH of the guard cells, H~ K“ CT. organic acid temperature. ABA and conditions of water stress. The stomata do not open under U far-red and green wavelength. The best stomatal opening occurs under blue light.
Factors affecting transpiration. Several environmental factors influence transpiration such as humidity, temperature, light, wind atmospheric pressure, and available soil water.
- The transpiration rate is directly proportional to saturation deficit and inversely to atmospheric pressure.
- The plant factors that influence transpiration are root-shoot ratio, leaf area, and leaf structure. Pruning of plants increases transpiration per unit leaf area.
- High temperature and low humidity In the atmosphere increase the rate of transpiration.
- An increase in the wind velocity increases the rate of transpiration by removing the water vapor from the vicinity of the plant However excessive wind velocity decreases the rate of transpiration inducing the closure of stomata due to loss of water from the guard cells by drying.
Significance of transpiration. Transpiration is thought to maintain the temperature of the plant, absorption, and ascent of sap, the maintenance of turgidity, and mineral translocation. But these activities seem to be independent of transpiration.
Water Relations In Plant Cells NEET Study Material
Measurement of Transpiration
- Measurement of stomatal opening can be done directly under the microscope, by Molisch’s injection method and perimetry. The porometers are of two types-viscous flow porometer and diffusion porometer.
- Transpiration can be measured qualitatively by the cobalt chloride method (Hygroscopic method) and quantitatively by photometers and the calcium chloride method.
- In Ganong’s photometer an air bubble moves whereas in Farmer’s photometer the entire water column moves. The latter instrument is regarded as the best one for measuring transpiration. By photometers, we measure suction due to transpiration.
By the calcium chloride method, we find out the change in the weight of CaCl, due to cuticular or stomatal transpiration.
- Transpiration flux is the quantity of water transpired by a unit area of leaf surface in a unit of time.
- Transpiration ratio (Lowes 1850). The amount of water lost per unit of dry matter produced during the growing season is called transpiration ratio,
- 50 Units—CAM plants
- 100-200 Units—C4 plants
- 300-500 Units—Mesophytes
- 900 Units—Alfalfa
Guttation. It is the loss of water through hydathodes. The term guttation was coined by Bergerstein. Guttation is a normal process in Colocasia antiquorum. (200 ml) Nasturtium. tomato, potato.
- Water is essential for all physiological activities of plants and acts as an excellent solvent, helping in the uptake and distribution of mineral nutrients and other solutes required for growth and distribution.
- The potential energy of water is termed water potential,
- The common measurement unit of water potential is pas¬ cal, Pa (J Megapascal, Mpa = 10 bars) and is represented By the Greek letter psi.ψ
- Three factors influence water potential arc Concentration, pressure, and gravity.
- ψ=ψs+ψp+ψg
- TheoreticalIy ψ of pure water is taken as zero and therefore ψ inside plant cell is negative.,
- The term ψs is called solute potential or osmotic potential, lFp as pressure potential or hydrostatic pressure, and ψp as gravity potential.
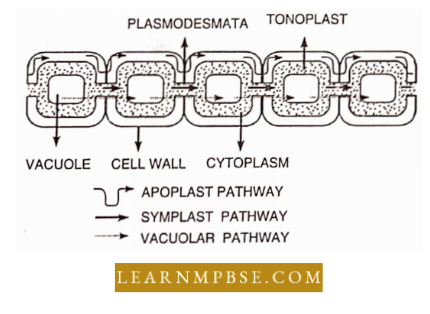
- The watering root moves through the apoplast pathway, symplast pathway, and vacuolar pathway.
The Casparian strip is composed of a wax-like substance called Suberin which blocks water and solute movement through the cell wall of the endodermis.
- A solution has an osmotic potential (solute potential) which is negative of osmotic pressure (πpi) thus
- ψs=-π
- Imbibition pressure is also known as matric potential,
- Two conditions are necessary for imbibition to take place. i.e. water potential gradient between the surface of the adsorbent or liquid imbibed and affinity between adsorbent and imbibed liquid.
- The three most important theories of water translocation are root pressure, capillary, and cohesion theory.
Stomatal Frequency and Stomatal Index The number of stomata per unit area of the leaf is described as stomatal frequency.
- Stomatal frequency is not fixed for a species. It differs with the position of the leaves on the plant and external conditions like humidity.
- Stomatal frequency is also affected by the osmotic pressure of the leaf cells.
- The stomatal index is defined as the percentage number of stomata as compared to all the epidermal cells (in-eluding stomata) in a unit area of the leaf. Salisbury (1927) found a correlation between the number of stomata and the epidermal cells per unit area.
- I=S\E+S×100
- Here I = Stomatal Index, number of stomata for unit area, E = number of epidermal cells per unit area. The Stomatal Index is independent of environmental conditions and not affected by conditions like the position of the leaf and the age of the plant.
- The principle involved in the osmotic theory of active water absorption
- Passive absorption of water was proposed by Kramer and Lachenmeir.
- The theory of passive absorption works on the following principle.
NEET Biology Plant Water Relations Quanta To Memory
- Lasitmts syndics sends its roots to a depth of four meters,
- Wclwitschid mirabilis can penetrate its roots to a distance of 18 meters.
- Dr. Dinner found that the total, length of roots (minus root hairs) formed by a rye plant in Four months is about 620 km. covering a total surface area of 255 sq. meters.
- The equimolar concentration of two solutions of non¬ionising substances will have the same osmotic pressure. In evident plasmolysis, cytoplasm withdraws itself from the cell wall. O.P. does not increase by the addition of insoluble solute in the solution.
- D.P.D. can become zero (fully turgid cell). T.P. can also become zero (flaccid cell). However, OP. of a cell can never be zero.
- Water does not move Inside the cell when T.P. = O.P.
- Suction pressure S.P.=O.P.-T.P.
- One gm. mole of solute dissolved in 1 lit./lOOO c.c. of the solution is the molal solution. However, one gm. mole of a solute when added to 1 lit./1000 C.c. of the solution is the molar solution.
- Root pressure is absent in gymnosperms.
- Less than 2 percent of all the water that a plant absorbs is required for its various uses.
Severe drought stress or intense solar radiation causes the production of a plant hormone abscisic acid which signals the closure of stomata. - Wilting and water-logging. In water-logged soils, the plants often show wilting. It is caused by the development of ethylene precursor by the roots (Bradford and Young, 1981) which reaching the shoot brings about wilted conditions.
- Plants with when turgor pressure inside the cells of such tissue go down below zero.
- Bajra, sorghum, and ragi require relatively low inputs of water while coffee, tea, coconut, rosewood, teak, willow, and bamboo need large quantities of water.
- Anti-transpirants increase leaf resistance to water vapor diffusion without affecting carbon dioxide uptake e.g. Phenyl mercuric acetate and waxy materials.
- Tensile Strength of Water. It is the ability of the water column to get stretched without breaking. The value is 45-207 atm (Dixon and Jolly, 1894). Tensile strength is due to cohesive force amongst molecules of water and adhesion between water molecules and walls of the xylem.
- J.C. Bose proved in the case of Desmodium gyrans that pulsating movement is developed in the cells that pump water to the next higher cell.
- The above fact was confirmed by Molisch.
- Stomatal opening in darkness was explained by Fujino (1967), Fisher (1968), Levitt (1974), and Rask (1975). The unit of water potential is bars
- Potometer. It is an apparatus for measuring the rate of transpiration.
- Poromcler. It is nil apparatus for knowing the relative sizes of stomata.
Osmosis And Plasmolysis NEET Question Bank
- Almometer. It is an apparatus for demonstrating and measuring pull caused by the evaporation of water In a porous pot,
- Psychrometer. It is an instrument for measuring both relative humidity and transpiration.
- Tramsiometer. It is an instrument that measures soil water tension.
- A barometer is used for measuring atmospheric pressure.
- A manometer is used for measuring pressure like root pressure
- A pressure chamber is used for measuring the water potential of whole leaves, shoots, etc.
- A cryoscopic osmometer measures the osmotic potential of the solution by measuring its freezing point.
- The term osmosis was coined by Nollct.
- The term “osmotic pressure” was proposed by PI’effer.
- The concept of “water potential” was proposed by Slatyer and Taylor.
- “Ringing experiments to prove that xylem is the path for the ascent of sap were first conducted by Malpighii (1672), Stephan Hales (1772), and Hartig.
- The term root pressure was coined by Stephen Hales (1727)
- Stocking (1956) considered guttation and bleeding as the manifestations of root pressure.
- Schwcndcner (1881) was the first to propose that the opening and closing of stomata occur due to the change in the turgor pressure of the guard cells.
- Levitt (1974) proposed an active K+ transport mechanism for opening and closing of stomata.
- Curtis (1926) considered transpiration “as a necessary evil” in plants.
- Bowling proposed a K+ ion transport mechanism for the opening of stomata (K+ ions as osmoticum).
- Zelitch proposed the role of glycolic acid in the opening of stomata.
- Absorption Lag (Kramer, 1937). It is the shortfall of the rate of water absorption over the rate of transpiration.
- The aerial roots of epiphytic roots have specialized tissue (velamen) for absorbing rainwater and condensed water vapors.
- Water logging reduces soil oxygen and decreases water absorption.
- Cell sap of root hair usually possesses higher OP (2-8 atm) compared to OP of soil water (<1 atm).
- No water is absorbed below the permanent wilting percentage or wilting coefficient.
- No water is absorbed in frozen soil as frozen soil is impermeable to water.
- The rate of water absorption decreases below 20°C because of increased viscosity of water, decreased permeability of the membrane, poor root growth, and low metabolic rate.
- Water is generally absorbed when the concentration of root hair cell sap is more than outer soil water.
NEET Biology Plant Water Relations MCQs
Question 1. The bullion cells of monocotyledon leaves show
- Tropic movement
- Autonomic movement
- Nastic movement
- Turgor movement.
Answer: 4. Turgor movement.
Question 2. Water will be absorbed by the root hairs when :
- Plants are rapidly respiring
- The concentration of salts in the soil is high
- The concentration of solutes in the cell sap is high
- They are separated from the soil by a permeable membrane.
Answer: 3. Concentration of solutes in the cell sap is high
Question 3. In which of the following plants would metabolism be hindered if the leaves were coated with wax on their upper surface?
- Vallisneria
- Pistici
- Lotus
- Hydrilla.
Answer: 3. Lotus
Question 4. Stomata open at night and close during the daytime in
- Succulents
- Mesophytes
- Hydrophytes
- Herbs.
Answer: 1. Succulents
Plant Water Relations NEET Mcqs
Question 5. During the rainy season, doors made up of wood generally swell up due to :
- Osmosis
- Had workmanship
- Imbibition
- Bad quality of wood.
Answer: 3. Imbibition
Question 6. Dumb-bell shaped guard cells are characteristics of:
- Herbs
- Dicot leaf
- Isobilateral leaf
- Scale leaf.
Answer: 3. Isobilateral leaf
Question 7. The closing and opening of stomata is due to an influx of:
- K+ ions
- Na ions
- Fe ions
- Mg ions.
Answer: 1. K+ ions
Question 8. Pure water has a water potential which is :
- zero
- Negative
- High
- Very low.
Answer: 1. zero
Question 9. The amount of water absorbed to compensate for the loss of transpiration is measured by :
- Potometer
- Crescograph
- Manometers
- Auxanometers.
Answer: 1. Potometer
Question 10. The inward pressure exerted on the cell contents by the stretched cell wall is termed :
- Osmosis
- Wall pressure
- Turgor pressure
- Osmotic pressure.
Answer: 2. Wall pressure
Question 11. The form and structure of a growing cell is maintained due to :
- Atmospheric pressure
- Plasmolysis
- Turgidity
- Wall pressure.
Answer: 3. Turgidity
Question 12. The water potential and osmotic potential of pure water are :
- 100 and zero
- Zero and Zero
- 100 and 100
- Zero and 100.
Answer: 2. Zero and Zero
Plant Water Relations NEET Mcqs
Question 13. The membrane that allows certain molecules to enter into the cell and prevents others is known as:
- Impermeable membrane
- Permeable membrane
- Selectively permeable membrane
- Unit membrane.
Answer: 3. Selectively permeable membrane
Question 14.” The vacuolar membrane is known as :
- Cell membrane
- Plasmalemma
- Chromoplast
- Tonoplast.
Answer: 4. Tonoplast.
Question 15. Due to osmosis, water enters into a cell and results in hydrostatic pressure. This is known as :
- Osmotic pressure
- Wall pressure
- Turgor pressure
- Low pressure.
Answer: 3. Turgor pressure
Question 16. The plasmalemma, cytoplasmic film, and the vacuolated membrane in an osmotic system of a vacuolated cell constitute the :
- Permeable membrane
- Impermeable
- Electively permeable membrane
- Unit membrane.
Answer: 3. Electively permeable membrane
Question 17. Exosmosis takes place when a plant cell is put in :
- Hypertonic solution
- A hypotonic solution
- An isotonic solution
- Non-ionic solution.
Answer:1. Hypertonic solution
Question 18. Endosmosis occurs when a plant cell is put in :
- A hypertonic solution
- Hypotonic solution
- An isotonic solution
- Non-ionic solution.
Answer:2. Hypotonic solution
Question 19. If there is no net movement of water into a cell from the outside medium, the medium is :
- Isotonic to the cell sap
- Hypertonic
- Hypotonic
- Non-ionic.
Answer: 1. Isotonic to the cell sap
Question 20. During absorption of water by roots, the water potential of cell sap is lower than that of:
- Pure water and soil solution
- Neither pure water nor soil solution
- Soil solution but higher than that of pure water
- Pure wafer but higher than that of soil solution.
Answer: 1. Pure water and soil solution
Plant Water Relations NEET Mcqs
Question 21. When a cell is fully turgid, it:
- O.P. = D.P.D.
- OP = Zero
- DCP.D = zero
- D.P.D. = O.P.
Answer: 3. DCP.D = zero
Question 22. A cell increases in volume when placed in a solution which is:
- Isotonic
- Hypotonic
- Hypertonic
- None of the above.
Answer: 2. Hypotonic
Question 23. DPD stands for:
- Diffusion pressure deficit
- Diffusion pressure demand
- Daily photosynthetic depression
- Daily phosphorus demand.
Answer:1. Diffusion pressure deficit
Question 24. The force responsible for water entry into the cell is :
- Diffusion
- DPI
- Osmotic pressure
- Wall pressure.
Answer: 2. DPI
Question 25. Minerals are absorbed by the plants from the soil ;
- By a process independent of water absorption
- Independently of water
- Only when soil solution is hypertonic to cell sap
- Only when soil solution is hypotonic to cell sap.
Answer: 1. By a process independent of water absorption
Question 26. The osmosis means :
- Movement of molecules from an area of higher concentration into an area of lower concentration
- Uptake of water by plant roots
- Passage of solvent from a weak solution to a strong solution when the two are separated by a semi-permeable membrane
- Passage of solute from a weak solution to a strong solution when the two are separated by a semi-permeable membrane.
Answer: 3. Passage of solvent from a weak solution to a strong solution when the two are separated by a semi-permeable membrane
Question 27. Starch is changed to organic acids during :
- Stomatal initiation.
- Stomatal closure
- Stomatal opening
- Stomatal growth.
Answer: 3. Stomatal opening
Question 28. Selective permeability is the main property of:
- Osmosis
- Diffusion
- Active transport
- Imbibition.
Answer: 3. Active transport
Question 29. When placed in water seeds swell, due to :
- Hydrolysis
- Osmosis
- Imbibition
- None of the above.
Answer: 3. Imbibition
Question 30. Most of the physiological reactions in plants occur at a pH of:
- 4.0
- 8.0
- 7.0
- 14.0.
Answer: 3. 7.0
Question 31. The movement of water from one cell of the cortex to the adjacent one in the roots is due to :
- Accumulation of inorganic salts in the cells
- Water potential gradient
- Accumulation of organic salts in the cells
- Chemical potential gradient.
Answer: 2. Water potential gradient
Plant Water Relations NEET Exam Preparation
Question 32. Which of the following factors is most important in the regulation of transpiration?
- Temperature
- Humidity
- Light
- Wind.
Answer:2. Humidity
Question 33. If the volume of a cell decreases after being placed in a solution, the solution is :
- Isotonic
- Hypertonic
- Hypotonic
- Normal.
Answer: 2. Hypertonic
Question 34. If cell A with, DPD, 4 bars are connected to cells B, C, and D whose OP and TP are respectively 4 and 4, 10 and 5, and 7 and j bar, the flow of water willies-
- C to A, B, and D ‘
- A and D to B and C
- A to B, C, and D ‘
- B to A, C, and D.
Answer: 3. A to B, C and D ‘
Question 35. The energy source that drives the upward flow of water is:
- Temperature
- Sucrose
- Solar energy
- ATP.
Answer: 4. ATP.
Question 36. To initiate cell plasmolysis, the salt solution should be
- Isotonic
- Hypertonic
- Hypotonic
- None of the above.
Answer: 2. Hypertonic
Question 37. Plant cells submerged in distilled water will become :
- Turgid
- Flaccid
- Plasmolyzed
- Impermeable.
Answer:1. Turgid
Question 38. Which of the following plant cells has more negative water potential?
- Cell with high osmotic pressure
- Cell with high turgor pressure
- Cell with high wall pressure
- Cell with low osmotic pressure.
Answer:1. Cell with high osmotic pressure
Question 39. Protoplasm is :
- True solution
- Colloidal solution
- Suspension
- None of the above.
Answer: 2. Colloidal solution
Question 40. Plasma membrane helps :
- In protein synthesis
- Regulates the passage of water only.
- Regulates the passage of water and dissolved Substances into and out of cells
- Protects the cell.
Answer: 3. Regulates the passage of water and dissolved Substances into and out of cells
Plant Water Relations NEET Exam Preparation
Question 41. The cell wall is permeable and can be observed from the passage of water and minerals from’?”
- Root hair into cortical cells
- Cortical cells into endodermis
- Soil into root hairs
- Cortical cells into pericycle.
Answer: 3. Soil into root hairs
Question 42. Deplasmolysis into the cell occurs which is placed in:
- Isotonic solution
- hypotonic solution
- Hypertonic solution
- None of these.
Answer:2. hypotonic solution
Question 43. Purple cabbage leaves do not lose their color in cold water but do so in boiling water because :
- The plasma membrane becomes permeable in boiling water and pigments come out
- Hot water can enter the cells readily
- The pigment is not soluble in cold water
- The cell wall is killed by boiling water.
Answer: 1. The plasma membrane becomes permeable in boiling water and pigments come out
Question 44. Osmosis is defined as the process by which :
- Water diffuses from lower concentration to higher concentration
- Solutes diffuse from lower concentration to higher concentration
- Active transport of ions takes place
- Passive transport of ions takes place.
Answer:1. Water diffuses from lower concentration to higher concentration
Question 45. Water potential in the leaf tissue is positive (+ve) during :
- Excessive transpiration
- Low absorption
- Low transpiration
- Guttation.
Answer: 3. Low transpiration
Question 46. With the increase in turgidity of a cell surrounded by water the wall pressure will:
- Increase
- Decrease
- Fluctuate
- Remain unchanged.
Answer: 1. Increase
Question 47. The ultimate cause of water movement against gravity is :
- Osmosis
- Imbibition
- Transpiration pull
- Respiration.
Answer: 3. Transpiration pull
Plant Water Relations NEET Exam Preparation
Question 48. When a plant wilts, what will be a sequence of events :
- Exosmosis, deplasmolysis, plasmolysis, temporary and permanent wilting
- Exosmosis, plasmolysis, temporary and permanent wilting
- Exosmosis, plasmolysis, deplasmolysis, temporary and permanent wilting
- Endosmosis, plasmolysis, temporary and permanent wilting.
Answer: 2. Exosmosis, plasmolysis, temporary and permanent wilting
Question 49. The process of osmosis stops when:
- The solution is not isotonic
- Water concentration becomes equal
- There is no light
- The leaves fall.
Answer: 2. Water concentration becomes equal
Question 50. The rate of absorption of water is slow at temperatures near the freezing point:
- It is mainly a metabolic process
- Cell membrane becomes more viscous
- The growth of cells stop
- Transpiration is retarded.
Answer: 4. Transpiration is retarded.
Question 51. The outward pressure exerted on the cell wall by the fluid contents of the cell wall is called:
- Turgor pressure
- Wall pressure
- Osmosis
- None of the above.
Answer: 1. Turgor pressure
Question 52. Dixon and Jolly’s are associated with :
- Aerobic respiration
- Calvin cycle allision
- Cohesion theory of ascent of sap
- Light reaction.
Answer: 3. Cohesion theory of ascent of sap
Question 53. Which plants do not generate root pressure?
- Monocot grasses
- Perennial shrubs
- Conifer trees
- Seasonal herbs.
Answer: 3. Conifer trees
Question 54. Transpiration cohesion tension theory operates in :
- Active absorption
- Passive absorption
- Both active and passive absorption
- None of the above.
Answer:2. Passive absorption
Question 55. Which plant is used for demonstrating plasmolysis in the laboratory?
- Tropeolum
- Patience balsamic
- Tradescantia
- All the above.
Answer: 4. All the above.
Question 56. Transpiration takes place from :
- Leaves
- Stem
- All aerial parts of the plant
- All parts of the plant body.
Answer: 3. All aerial parts of the plant
Question 57. Much of transpiration takes place through :
- Epidermis
- Lenticels
- Stomata
- Cuticle.
Answer: 3. Stomata
Question 58. Transpiration from plants will be more rapid when :
- The atmosphere is saturated with water
- There is excess water in the soil
- Environmental conditions are dry
- Air is still.
Answer: 3. Environmental conditions are dry
Question 59. Guttation takes place through :
- Stomata
- Hydathodes
- Lenticels
- Cuticle.
Answer: 2. Hydathodes
Question 60. If cohesion-tension transpiration theory is correct then a break in the water column in xylem vessels :
- This should cause the mesophyll cells to become flaccid and result in the wilting of leaves.
- Should increase the water contents of leaves
- Should have no effect at all
- Should increase the rate of photosynthesis.
Answer: 1. This should cause the mesophyll cells to become flaccid and result in the wilting of leaves.
Plant Water Relations NEET Previous Year Questions
Question 61. According to Scarth, opening and closing of stomata is controlled by :
- Enzymes
- pH value
- NADP
- Hormones.
Answer:2. pH value
Question 62. Stomata are bounded by guard cells and open when the cells are :
- Turgid
- Flaccid
- Green
- Small.
Answer: 1. Turgid
Question 63. Stomata open during the time because the guard cells :
- Photosynthesize and produce osmotically active sugars
- Are thick-walled
- Are bean-shaped
- Have to help in gaseous exchange.
Answer: 1. Photosynthesize and produce osmotically active sugars
Question 64. Which one is not related to transpiration?
- Bleeding
- Circulation of water
- Absorption and distribution of mineral salts
- Regulation of plant body temperature.
Answer:1. Bleeding
Question 65. A small mesophytic twig with green leaves is dipped into water in a big beaker under sunlight. It demonstrates :
- Photosynthesis
- Respiration
- Transpiration
- None of the above.
Answer: 3. Transpiration
Question 66. The phytohormone which is supposed to be one of the factor responsible for regulating the opening and closing of stomata:
- ABA
- GA
- IBA
- Kinetin.
Answer: 1. ABA
Question 67. Which of the following changes in the cell sap of the guard cell is responsible for keeping stomata open during the daytime?
- Decrease in both osmotic and turgor pressure
- Increase in both osmotic pressure and turgor pressure
- Increase in osmotic pressure but decrease in turgor pressure
- Decrease in osmotic pressure but increase in turgor pressure.
Answer: 2. Increase in both osmotic pressure and turgor pressure
Question 68. Guard cells differ from epidermal cells in having :
- Mitochondrion
- Chloroplast
- Vacuole
- Cell wall.
Answer: 2. Chloroplast
Question 69. If the C02 concentration of the atmosphere were to increase :
- Stomata will close partially
- Respiration will decrease
- Stomata will open
- Photorespiration will increase.
Answer: 1. Stomata will close partially
Question 70. Which one of the following factors is most important in the regulation of transpiration?
- Light
- Humidity
- Temperature
- Wind.
Answer: 1. Light
Question 71. Which of the following is the most likely cause for the wider opening of stomata?
- The atmosphere outside the stoma is becoming less humid
- Secretions of salt molecules by the adjacent guard cells take place
- Water molecules enter the guard cells
- The night temperature is going to fall.
Answer: 3. Water molecules enter the guard cells
Question 72. Cohesion tension theory of water transport is based on :
- Root pressure
- Activity of parenchyma to the proximity of conducting vessels and tracheids.
- Activity of phloem
- Transpiration pull.
Answer: 4. Transpiration pull
Question 73. The value of water potential (yw) can be obtained by :
- π+WP
- ψs+ψp
- ψ + WP
- ψ + TP.
Answer: 2. ψs+ψp
Question 74. The bulliform cells of leaves lose their turgidity during excessive :
- Assimilation
- Transpiration
- Photosynthesis
- Respiration.
Answer: 2. transpiration
Plant Water Relations NEET Previous Year Questions
Question 75. A freshly cut potato chip is put into a strong solution of sugar. Later it is found to be :
- Flaccid
- Longer
- Turgid
- More full of starch.
Answer:1. Flaccid
Question 76. Which of the following processes in excess causes temporary wilting?
- Respiration
- Transpiration
- Photosynthesis
- Imbibition.
Answer: 2. Transpiration
Question 77. Osmotic pressure is responsible l\>v tho turgidity of plant colls which;
- Causes cell elongation
- Causes opening to stomata
- Prevents willing to leave
- All the three above,
Answer: 4. All the three above,
Question 78. Hydathodes are present:
- On the upper sin face of the leaf
- On the lower surface of the leaf
- At the tip of the vein of the leaf
- At the base of the veins of the leaf.
Answer: 3. At the tip of the vein of the leaf
Question 79. The cohesion theory of the ascent of sap was given by ;
- Sachs
- Dixon and Jolly
- Bose
- Robert Brown,
Answer: 2. Dixon and Jolly
Question 80. Spraying of phenyl mercuric
- Increases transpiration
- Reduces transpiration
- Increases rate of photosynthesis
- Causes guttation.
Answer: 2. Reduces transpiration
Question 81. Silicone emulsions when used:
- Increase transpiration
- Reduce transpiration
- Increase rate of photosynthesis
- Cause guttation.
Answer: 2. Reduce transpiration
Question 82. With the increase in turbidity of a cell surrounded by water. the wall pressure will?
- Increase
- Decrease
- Fluctuate
- Remain unchanged.
Answer: 1. Increase
Question 83. Transpiration is:
- Not necessary for plants
- Necessary for plants
- Avoidable
- A necessary evil.
Answer: 4. A necessary evil.
Question 84. A plasmolyse cell can be plasmolyse by placing it in :
- Pure water or hypotonic solution
- Hypertonic solution
- Isotonic solution
- Saturated solution.
Answer: 1. Pure water or hypotonic solution
Question 85. Leaves of xerophytes have thick cuticle, hairs, fewer and sunken stomata in order to :
- Facilitate transpiration
- Slop transpiration
- To minimize excessive transpiration
- Store water.
Answer: 3. To minimize excessive transpiration
Question 86. The rate of transpiration is regulated by the movement of:
- Epidermal cells of the leaves
- Guard cells of the stomata
- Mesophyll tissue of the leaves
- Cuticle.
Answer: 2. Guard cells of the stomata
Question 87. The low atmospheric pressure :
- Increases the rate of transpiration
- Decreases the rate of transpiration slowly.
- Doesn’t affect the rate of transpiration rapidly
- Decreases the rate, of transpiration rapidly.
Answer: 1. Increases the rate of transpiration
Plant Water Relations NEET Previous Year Questions
Question 88. If alcohol treated cell is kept in a hypertonic solution it:
- Bursts
- Plastnolysed
- Remains same
- None.
Answer: 3. Remains same
Question 89. The distribution of stomata per unit area of leaf and their size affects the rate of:
- Respiration
- Transpiration
- Guttation
- Absorption.
Answer:2. Transpiration
Question 90. In a dorsiventral leaf, the number of stomata is:
- Same on both sides
- Large on the upper epidermis
- Huge on the lower epidermis
- Lesser on lower than upper epidermis.
Answer: 3. Huge on the lower epidermis
Question 91. The restoration of turgidity in a plasmolyse cell, when placed in a hypotonic solution is caused by :
- Hydration
- Electrolysis
- Plasmolysis
- Deplasmolysis
Answer: 4. Deplasmolysis
Question 92. Water In plants is transported by (Ascent of sap takes placed through)?
- Cambium
- Epidermis
- Xylem or Xylem vessel elements
- Phloem
Answer: 3. Xylem or Xylem vessel elements
Question 93. The principal pathway by which water is translocated in angiosperms is:
- xylem and phloem together
- sieve tube members of phloem only
- sieve cells of the phloem
- xylem vessels system,
Answer: 4. xylem vessels system
Question 94. For conducting a girdling experiment:
- The cortex is removed
- The cortex anil primary phloem arc removed
- All tissue up to the xylem is removed
- Bark alone is removed.
Answer: 3. All tissue up to the xylem is removed
Question 95. Active absorption of ions is facilitated by :
- Oxygen
- ATP
- More effective plasma membrane
- Slightly higher temperature.
Answer: 2. ATP
Question 96. Levitt’s explanation for stomatal action is due to the:
- Increase in sugar content of guard cells
- Variations in pH value
- Starch is converted into organic acids
- Light causes opening and darkness closure.
Answer: 3. Starch is converted into organic acids
Question 97. Stomatal aperture is measured by ;
- Micrometer
- Potometer
- Photometer
- Luxometer.
Answer: 1. Micrometer
Question 98. The loss of water through the cuticle may reach up to:
- 5%
- 10%
- 20%
- 40%.
Answer: 2. 10%
Question 99. Which of the following walls is of the guard cell is thick:
- Outer
- Inner
- Sidewall
- All the walls,
Answer: 2. Inner
Question 100. The chief role of transpiration in plants is to cause :
- The rapid rise of minerals
- The rapid ascent of sap
- Cooling of plants
- Loss of surplus waiter.
Answer: 2. The rapid ascent of sap
Question 101. The stomata are widely open in :
- Red light
- Blue and red light
- Greenlight
- Yellow light.
Answer: 2. Blue and red light
Plant Water Relations NEET Notes
Question 102. At Full turgor in a cell:
- ψ=0 and hence ψs= ψw
- ψa= 0
- ψp = ψw
- ψp = – ψs and ψw =0
Answer: 4. ψp = – ψs and ψw =0
Question 103. Positive root pressure can be demonstrated :
- At noon
- The early morning
- In the evening
- Only during the night.
Answer: 4. Only during the night.
Question 104. The plant is said to be wilted permanently when it:
- Fails to revive at all
- Revives if the soil is watered
- Revives if kept in a saturated atmosphere
- Revives when it is fanned.
Answer: 1. Fails to revive at all
Question 105. The movement of water up through a tree trunk depends on:
- The high boiling point of water
- Exclusion of air molecules from the sap solution
- The vapor pressure of water
- Attraction between water molecules.
Answer: 4. Attraction between water molecules.
Question 106. The girdling experiments performed by Malpighii supported the theory that:
- Water moves in a tree by the root pressure mechanism
- Water moves in a tree by a transpiration-cohesion mechanism
- The xylem is primarily responsible for conducting water from the roots to the leaves
- Phloem is primarily responsible for conducting organic solutes.
Answer: 3. The xylem is primarily responsible for conducting water from the roots to the leaves
Question 107. The osmotic potential of a solution is denoted by the symbol :
ψx
Δψ
ψp
ψs.
Answer: 4. ψs.
Question 108. Osmosis is defined as :
- The flow of solvent molecules from a region of higher concentration to a region of lower concentration through a semipermeable membrane
- The flow of low-concentration liquid
- The flow of solvent molecules from a higher concentration to a lower concentration region
- The flow of solvent molecules from a lower concentration to a higher concentration region.
Answer: 1. The flow of solvent molecules from a region of higher concentration to a region of lower concentration through a semipermeable membrane
Question 109. A root concentrates minerals by :
- Active transport
- Facilitated diffusion
- Osmosis
- Diffusion.
Answer: 1. Active transport
Question 110. A cell placed in a hypertonic solution will:
- Initially gets plasmolysed but later becomes turgid if actively metabolising
- Get plasmolysed and die
- Remain turgid if treated with auxin
- All the above.
Answer: 4. All the above.
Question 111. When a bottle of perfume is placed in one corner of a room and the lid is opened, the scent spreads all over the room after some time. This happens by the process of :
- Plasmolysis
- Diffusion
- Endosmosis
- Transpiration.
Answer: 2. Diffusion
Plant Water Relations NEET Notes
Question 112. The path of water and solutes from the soil to the conducting tissue of the root is :
- Soil → root hair→ cortex→ endodermis →pericycle protoxylem →phloem
- Soil → root hair → cortex →A pericycle → endodermis →protoxylem → metaxylem
- Soil epidermal cell of the root cortex → endodermis → pericycle → protoxylem → metaxylem → secondary xylem
- Soil → root hair → cortex → endodermis → pericycle → protoxylem → metaxylem.
Answer: 4. Soil → root hair → cortex → endodermis → pericycle → protoxylem → metaxylem.
Question 113. Capillarity is regarded as relatively unimportant as a possible cause of sap rise because :
- Vessels do not show capillarity
- Capillarity would cause sap to rise only a few inches or a few feet
- The tracheids and vessels are very narrow
- Absorption between xylem walls and water molecules is very low.
Answer: 2. Capillarity would cause sap to rise only a few inches or a few feet
Question 114. What will be the nature of the sugar solution, if the cell of an epidermal peal of Rhoeo discolor shows plasmolysis :
- Hydrophobic
- Hypertonic
- Isotonic
- Hypotonic.
Answer: 2. Hypertonic
Question 115. Xylem channels of the rootlets maintain a low water potential due to :
- Maintenance of high salt content
- Presence of negative pressure of water tension
- Both A and B
- Occurrence of positive pressure.
Answer: 3. Both A and B
Question 116. Water and minerals move towards the vascular cylinder of a root, they must enter the cytoplasm of :
- Xylem cells
- Cortex cells
- Endodermal cells
- Pericycle cells.
Answer: 3. Endodermal cells
Question 117. Most vascular plants increase the absorption of minerals by:
- Mycorrhizae
- Convertible phloem
- Casparian channels along the phloem
- Companion cells.
Answer: 1. Mycorrhizae
Question 118. Endosmosis of water occurs when in comparison with the outer solution, the water potential of cell sap is :
- Higher
- Lower
- Equal
- None of the above.
Answer:2. Lower
Water Relations In Plant Cells NEET Study Material
Question 119. If the cell (X) with DPD = 5 atm. is surrounded by many cells with DPD = 4 atm :
- The net movement of water will be from cell X to the surrounding cells
- The net movement of water will be from the surrounding cells to cell X
- Water will not move at all
- Water movement will depend on other unknown factors.
Answer: 2. Net movement of water will be from the surrounding cells to cell X
Question 120. Uptake of mineral ions into the xylem is controlled by:
- Epidermal cells
- Cortex cells
- Endodermal cells
- Xylem cells.
Answer: 3. Endodermal cells
Question 121. The opening and closing of stomata in leaves of mesophytic plants is reduced by :
- Changes in C02, K ions, and ABA concentration, with simultaneous changes in the turgidity/ flaccidity of guard cells.
- Changes in the starch sugar concentration in the guard cells
- Changes in the H+ concentration in the guard cells
- Differential thickening of walls of the guard cells.
Answer: 1. Changes in C02, K ions, and ABA concentration, with simultaneous changes in the turgidity/ flaccidity of guard cells.
Question 122. Tick the correct statement:
- The amount of water absorbed by closely packed and loosely packed imbibing will depend upon the temperature of the medium
- Both will imbibe the same amount of water
- The closely packed imbibing will imbibe less water than the loosely packed one
- The closely packed imbibing will imbibe more water than the loosely packed one.
Answer: 3. The closely packed imbibing will imbibe less water than the loosely packed one
Question 123. Mark the correct statement:
- The value of TP remains the same at the time of limiting, incipient, and evident plasmolysis
- The value of T.P. becomes zero at the time of limiting plasmolysis and below zero during incipient and evident plasmolysis
- The value of T.P. becomes below zero at the time of limiting plasmolysis and zero at the time of incipient and evident plasmolysis
- The value of T.P. becomes negative in all the stages of plasmolysis. “
Answer: 2. The value of T.P. becomes zero at the time of limiting plasmolysis and below zero during incipient and evident plasmolysis
NEET Biology Plant Water Relations Questions For Competitive Examinations
Question 1. A twig kept in the water remains fresh for a longer time if some salt is added to it due to the:
- Absorption of more water
- Exosmosis
- Decrease in transpiration rate
- Decrease in bacterial degradation activity,
Answer. 3. Decrease in transpiration rate
Question 2. In the process of osmosis :
- Both protoplasm and cell wall act as a single layer
- Only protoplast acts as a single layer
- Only the cell membrane acts as a single layer
- None of the above.
Answer. 2. Only protoplast acts as a single layer
Question 3. 0.1 M solution of a solute has a water potential of:
- -2.3 bars
- 0 bar
- 22.4 bars
- +2.3 bars.
Answer. 1. -2.3 bars
Question 4. During absorption of water by roots the water potential of cell sap is lower than that of:
- Pure water and soil solution
- Neither pure water nor soil solution
- Pure water but higher than that of soil solution
- Soil solution but higher than that of pure water.
Answer. 1. Pure water and soil solution
Water Relations In Plant Cells NEET Study Material
Question 5. During osmosis, water moves through a membrane :
Answer. 4.
Question 6. Which ion accumulates in the guard cells at the time of
opening of stomata
- P “
- K
- Mg
- Ca.
Answer. 2. K
Question 7. Wilting occurs due to excessive :
- Respiration
- Absorption
- Guttation
- Transpiration.
Answer. 4. Transpiration.
Question 8. Bulliform cells respond to which change?
- Turgor pressure
- Osmotic pressure
- Photosensitive
- None of the above.
Answer. 1. Turgor pressure
Question 9. Glycolate induces the opening of stomata in :
- Presence of oxygen
- Low CO2 concentration
- High C02
- C02 absent.
Answer. 2. Low CO2 concentration
Question 10. Passive absorption of minerals depends on :
- Temperature and
- Metabolic inhibitor
- Metabolic inhibitor
- Humidity
Answer.4. Humidity
Osmosis And Plasmolysis NEET Question Bank
Question 11. When water moves through a semipermeable membrane, then which of the following pressures develops?
- O.P.
- S.P.
- T.P.
- W.P.
Answer. 1. O.P.
Question 12. In which of the following plant sunken stomata are found?
- Nerium
- Hydrilla
- Mango
- Guava.
Answer. 1. Nerium
Question 13. Match the names of the experiments listed under column I with the aim of the experiment given under column II; Choose the answer that gives the correct combination of die alphabets.
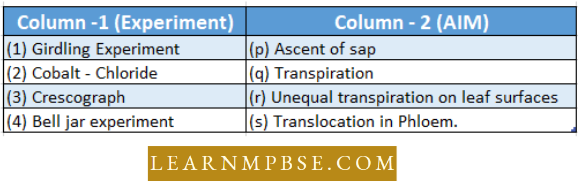
- a – r, b-p, c-s, d-q
- a-s, b-r, c-p, d-q
- a-s,b-p, c-q, d-r
- a-q, b-p, c-s, d-r.
Answer. 2. a-s, b-r, c-p, d-q
Question 14. Dry wooden stakes if driven into a small crack in a rock and then soaked, can develop enough pressure to split the rock. Such a pressure is built up through the phenomenon of:
- Imbibition
- Buttress roots
- Prop roots
- Turgor pressure.
Answer. 1. Imbibition
Question 15. The cohesive force existing between molecules of water contributes to :
- Ascent of sap
- Translocation
- Plasmolysis
- Osmosis.
Answer. 1. Ascent of sap
Question 16. In root pressure :
- Roots act like a pumping organ like the heart.
- Each cell acts as a pump
- Water potential plays a major role
- None of the above.
Answer. 3. Water potential plays a major role
Question 17. To initiate cell plasmolysis, the salt concentration must be:
- Isotonic
- Hypertonic
- Hypotonic
- Atonic.
Answer. 2. Hypertonic
Plant Water Relations NEET Mcqs
Question 18. The most accepted theory for stomatal opening and closing is:
- Transpiration
- Guard cell photosynthesis
- K+ efflux and influx
- Starch glucose interconversion.
Answer. 3. K+ efflux and influx
Question 19. The ascent of sap is mainly attributed to
- Cohesion force
- Imbibition
- Root pressure
- Capillarity.
Answer. 4. Capillarity.
Question 20. Water lost by transpiration is :
- Rich in solutes
- Rich in dissolved roots
- Rich in dissolved minerals
- Pure water.
Answer. 4. Pure water.
Question 21. The main function of Ienticels is:
- Transpiration
- Guttation
- Gaseous exchange
- Translocation.
Answer. 3. Gaseous exchange
Question 22. Solution concentration is higher in tire external solution.
The solution is :
- Isotonic
- Hypotonic
- Hypertonic
- one of the above.
Answer. 3. Hypertonic
Question 23. In CAM plants, stomata are :
- Always open
- Never open
- Open during the day and close at night
- Open during the night and close during the day.
Answer. 4 Open during the night and close during the day.
Question 24. Match the items in column I with the correct combination of column 11 :
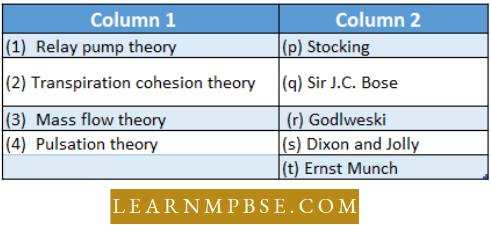
- p q r s
- r s t q
- r s q t
- s r t q
Answer. 2. r s t q
Question 25. Which one is responsible for opening and closing of stomata :
- Rise in pH of guard cells, hydrolysis of starch
- Cytokinins and CAMP required
- Abscisic acid promotes closure
- All the above.
Answer. 4. All the above.
Question 26. A plant cell becomes turgid due to :
- Plasmolysis
- Exosmosis
- Endosmosis
- Electrolysis.
Answer. 3. Endosmosis
Question 27. Bolometer works on the principle of :
- The amount of water absorbed equals the amount that transpired
- Osmotic pressure
- Root pressure
- The potential difference between the tip of the tube and that of the plant.
Answer. 1. The amount of water absorbed equals the amount that transpired
Question 28. Which of the following in the guard cell is responsible for for opening of stomata?
- Decrease in CO2 concentration and more H+ ion
- Decrease in CO2 concentration and less H+ ion concentration
- Increase in C02 concentration and more H+ ion concentration
- More free llf ion and less Cl ion.
Answer. 2. Decrease in CO2 concentration and less H+ ion concentration
Question 29. Identify the correct relationship with reference to the water potential of a plant cell.
- ψw = ψm + ψa + ψp
- ψw = ψm + [ψs – ψp ]
- ψw = ψm – [ψs + ψp ]
- ψw = ψm – ψa – ψp
Answer. 1. ψw = ψm + ψa + ψp
Question 30. Passive adsorption of water by the root system is the result of
- Forces created in the cells of the root
- Increased respiratory activity in root cells
- Tension on the cell sap due to transpiration
- Osmotic force in the shoot system.
Answer. 3. Tension on the cell sap due to transpiration
Question 31. Water is lost in a liquid state in some plants through hydathodes. These hydathodes
- Remain closed at night
- Remain closed during the day
- Remain always open
- Do not show any specificity in opening and closing.
Answer. 3. Remain always open
Plant Water Relations NEET Exam Preparation
Question 32. Choose the correct combination labeling of the stomatal apparatus of dicot and monocot leaves.
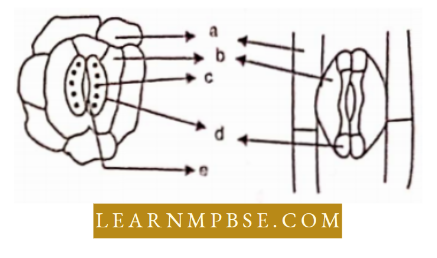
- a = epidermal cells, b = subsidiary cells, c = chloroplast, d = guard cells, e = stomatal aperture
- a = epidermal cells, b = guard cells, c = chloroplast, d = subsidiary cells, c – stomatal aperture
- a = epidermal cells, b = subsidiary cells, c = chloroplast, d = stomatal aperture, e = guard cells
- a = subsidiary cells, b = epidermal, c = chloroplastm. d = stomatal aperture, c = guard cells
- a = guard cells, b = epidermal cells, c = stomatal aperture, d = subisidary cells, e = chloroplast.
Answer. 1. a = epidermal cells, b = subsidiary cells, c = chloroplast, d = guard cells, e = stomatal aperture
Question 33. Which of the following statements are true/false?
A. The positive hydrostatic pressure is called turgor pressure
B. Wall pressure is exerted to prevent the increase in protoplasm size
C. Diffusion is more rapid in liquids than in gases
D. The diffusion of water through a semi-permeable membrane is called imbibition
E. osmosis is the movement of substances that takes place along a diffusion gradient.
- A and B are true & C, D, and E are false
- A and C are true & B, D, and E are false
- A and D are true & B, C, and E are false
- A and C are true & b, C, and D are false
- c, D, and E are true & A and B are false.
Answer. 1. A and B are true & C, D, and E are false
Question 34. Two cells A and B are contiguous. Cell A has an osmotic pressure of 10 atm, turgor pressure of 7 atm, and diffusion pressure deficit of 3 atm. Cell B has osmotic pressure S atm, turgor pressure 3 atm, and diffusion pressure deficit 5 atm. The result will be :
- No movement of water
- Equilibrium between the two
- Movement of water from cell A to B
- Movement of water from cell B to A.
Answer. 3. Movement of water from cell A to B
Question 35. Path of water movement from soil to xylem is:
- soil → root hair → cortex → pericycle → endodermis → metaxylem → protoxylem
- soil → root hair → cortex → endodermis → pericycle → protoxylem → metaxylem
- soil → root hair → epidermis → endodermis → phloem → xylem
- soil → root hair → epidermis → cortex → phloem → xylem
- soil → root hair → cortex → protoxylem → phloem → metaxylem.
Answer. 2. soil → root hair → cortex → endodermis → pericycle → protoxylem → metaxylem
Question 36. In land plants, the guard cells differ from other epidermal cells in having :
- Cytoskeleton
- Mitochondria
- Chloroplasts.
- Endoplasmic reticulum
Answer. 4. Endoplasmic reticulum
Question 37. The ability to rise in thin tubes and the ability to resist a pulling force are respectively referred to as
- Tensile strength and capillarity
- Adhesion and capillarity
- Cohesion and adhesion
- Cohesion and capillarity
- Capillarity and tensile strength.
Answer. 5. Capillarity and tensile strength.
Question 38. Which of the following criteria does not pertain to facilitated transport?
- High selectivity
- Transport saturation
- Uphill transport
- Requirement of special membrane proteins
Answer. 3. Uphill transport
Question 39. Lenticels are involved in :
- Gaseous exchange
- Food transport
- Photosynthesis
- Transpiration
Answer. 1. Gaseous exchange